Global Zero Emission Aircraft Market – Analysis and Forecast (2025-2030)
Industry Insights By Aircraft Type (Battery Electric Aircraft, Hydrogen Fuel Cell Aircraft, Hybrid Electric Aircraft and Solar Electric Aircraft), By Propulsion Type (Hydrogen Powered Aircraft, Electric Aircraft and Other Alternative Fuels), By Range (Short Haul Aircraft, Medium Haul Aircraft and Long Haul Aircraft), By Application (Passenger Transportation, Cargo & Freight and Military & Defense) and By Geography (North America, Europe, Asia-Pacific, Latin America, Middle East And Africa)
| About This Report | Status : Published | Published On : Sep, 2024 | Report Code : VRAD12036 | Industry : Aerospace and Defense | Available Format :

|
Page : 197 |
-
Report Description
Industry Overview
Report Description
The Zero Emission Aircraft Market is projected to grow from USD 0.7 billion in 2023 to USD 4.3 billion in 2030 at a CAGR of 36.7% during the forecast period from 2025 to 2030.
Zero Emission Aircraft refers to the manufacturing, development and deployment of aircraft that operate without producing any direct emissions of greenhouse gases. These aircraft utilize alternative propulsion systems and energy sources which eliminate the reliance on traditional fossil fuels contributing to an environmentally friendly aviation industry. Zero-emission aviation starts with green hydrogen. Green hydrogen is produced by taking renewable electricity from solar or hydro-power, wind and power electrolyzers. Various airports already use wind and solar power to decarbonize their operations. The aviation industry is increasingly focusing on hydrogen fuel cell technology as an alternative for zero-emission aircraft propulsion as these cells offer an efficient and clean power source which produce electricity with water vapor as its only by-product. The growing focus explore diverse sustainable energy solutions to address the challenges of zero-emission flight, long-range with the advancements in hydrogen fuel cell integration. Speedy urbanization and obstruction concerns have encouraged growing importance & investment in Urban Air Mobility (UAM). This trend drives the development of zero-emission Electric Vertical Takeoff and Landing (eVTOL) aircraft for urban transport. Increased investments has propelled the sustainable and on-demand air transportation ultimately boosting the growth of zero-emission aircraft technologies.
Market Segmentation
Insight by Aircraft Type
- Battery Electric Aircraft
- Hydrogen Fuel Cell Aircraft
- Hybrid Electric Aircraft
- Solar Electric Aircraft
Based on aircraft type, the global Zero Emission Aircraft Market is divided into battery electric aircraft, hydrogen fuel cell aircraft, hybrid electric aircraft, and solar electric aircraft. The hydrogen fuel cell aircraft segment accounted for the largest market share and is anticipated for substantial growth over the projected period.
Insight by Propulsion Type
- Hydrogen Powered Aircraft
- Electric Aircraft
- Other Alternative Fuels
The global Zero Emission Aircraft Market is divided by propulsion type into hydrogen powered aircraft, electric aircraft and other alternative fuels. Hydrogen powered aircraft dominate the market due to the superior quantity characteristic of hydrogen compared to conventional aviation. This increases air drags to reduce the plane's effectiveness.
Insight by Range
- Short Haul Aircraft
- Medium Haul Aircraft
- Long Haul Aircraft
On the basis of range, the global Zero Emission Aircraft Market is segregated into short haul aircraft, medium haul aircraft and Long haul aircraft. Short Haul Aircraft segment dominates the market as these flights covers short distance and carry fewer passengers which offer a greener option to conventional regional aircraft.
Insight by Application
- Passenger Transportation
- Cargo & Freight
- Military & Defense
The Zero Emission Aircraft Market is classified into Passenger transportation, Cargo & Freight and Military & Defense on the basis of its application. The passenger transportation segment dominates the zero emission aircraft market, as the aviation industry faces increasing pressure to reduce its environmental impact and contribute to global sustainability efforts.
Global Zero Emission Aircraft Market Report Coverage
|
Report Metric |
Details |
|
Historical Period |
2020 - 2024 |
|
Base Year Considered |
2025 |
|
Forecast Period |
2026 - 2035 |
|
Market Size in 2025 |
U.S.D. 0.7 Billion |
|
Revenue Forecast in 2035 |
U.S.D. 4.3 Billion |
|
Growth Rate |
36.7% |
|
Segments Covered in the Report |
By Aircraft Type, By Propulsion Type, By Range, By Application |
|
Report Scope |
Market Trends, Drivers, and Restraints; Revenue Estimation and Forecast; Segmentation Analysis; Impact of COVID-19; Companies’ Strategic Developments; Market Share Analysis of Key Players; Company Profiling |
|
Regions Covered in the Report |
North America, Europe, Asia-Pacific, Latin America, Middle East And Africa |
Industry Dynamics
Growth Drivers
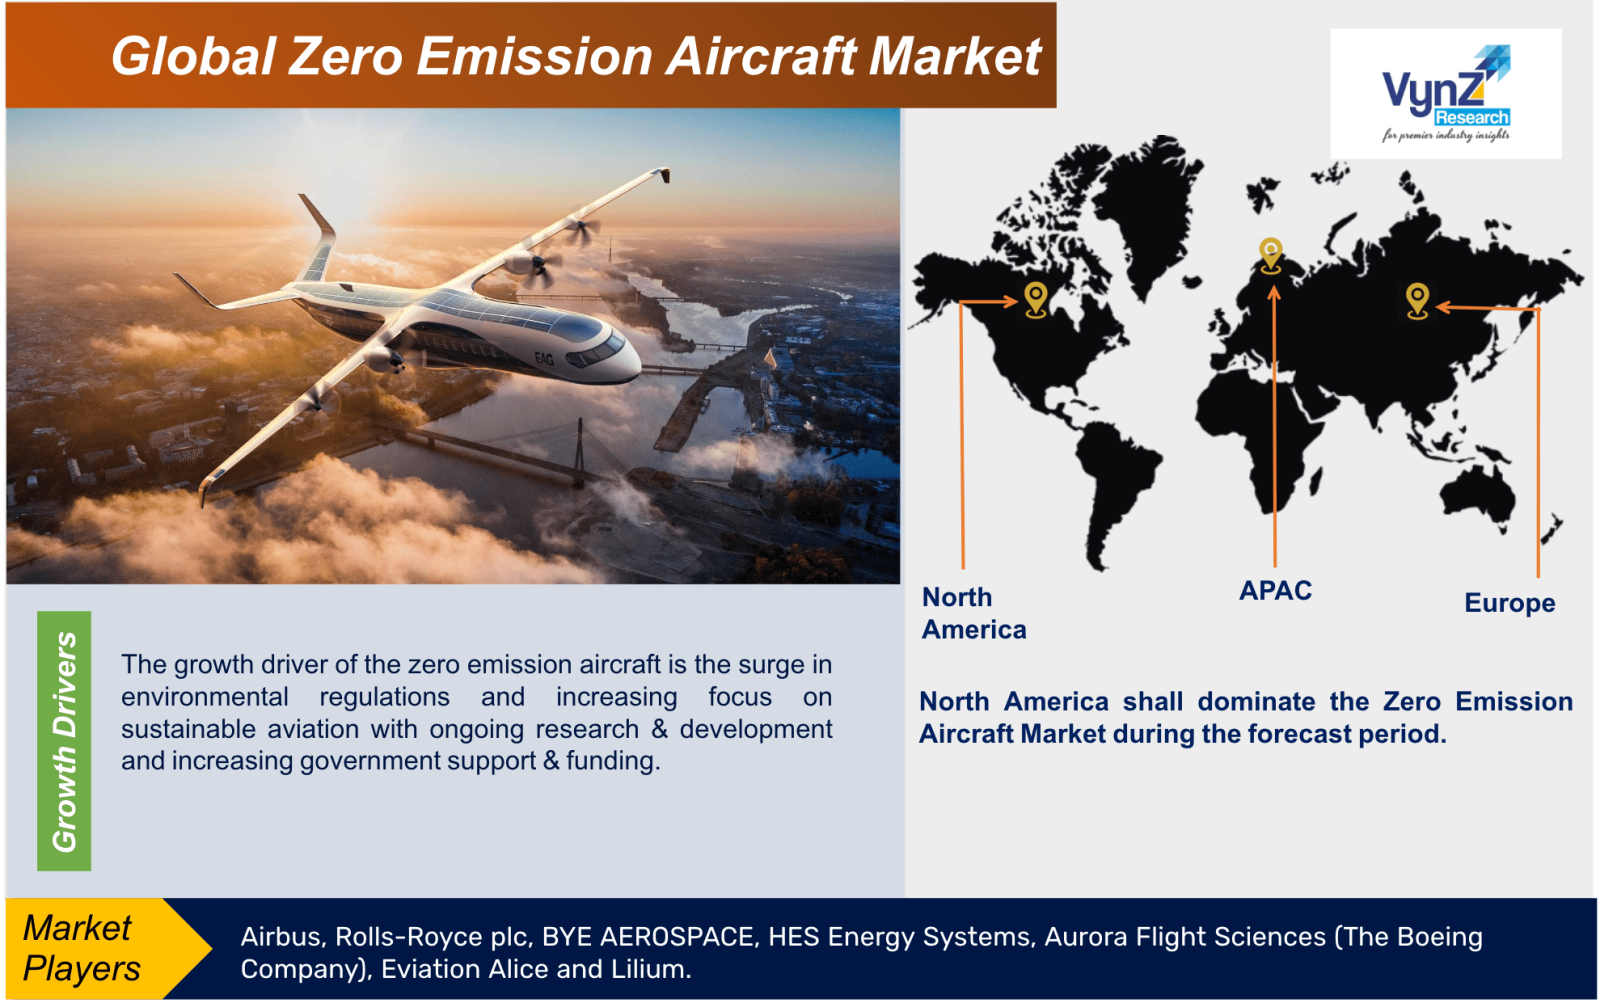
The growth driver of the zero emission aircraft is the surge in environmental regulations and increasing focus on sustainable aviation with ongoing research & development and increasing government support & funding. Implementation of stronger rules and emission reduction targets by government is also the growth driver of the market. Rapid advancements in battery and propulsion technologies too play important role in market growth. Collaborations and partnerships between the stakeholders in the industry accelerates the development of zero emission aircraft. Effective use of resources, the transfer of technologies and information exchange are promoted through these collaborations. Economic viability contributes to the market growth as the economies of scale are projected to lower the production costs. Battery-powered aircraft cost less to maintain & operate and are much quieter than fuel-powered aircraft.
Restraints
The main limitation of global Zero Emission Aircraft Market is the high cost associated with its technologies. Zero emission aircraft are more expensive as compared to the conventional fossil fuel powered-aircraft as its research, development and implementation require significant investment. To enable the extensive use of the zero emission aircraft, rules and standards should be developed which can be recognized internationally. Public awareness and acceptance is needed for the success of the zero emission aircraft. Limited manufacturing and supply chain for fuel cells and batteries are also hindering the market growth.
Geographic Overview
Geographically, the Zero Emission Aircraft Market is segmented into North America, Euope, Asia Pacific (APAC), Latin America and Middle East and Africa. North America shall dominate the Zero Emission Aircraft Market during the forecast period as the region is committed to sustainability along with substantial investments in research and development. Collaborations among industry players, supportive regulatory frameworks and increasing public awareness contribute to the region's prominence.
Competitive Insights
Key players adopted different strategies such as partnership, product launch and product development. The market is expected to become more competitive during the forecast period, as many companies from various sectors planning to use the huge opportunities to enter the market.
Airbus SE is an European multinational aerospace corporation. The company designs and manufactures commercial aircraft along with defence, space and helicopter divisions.
Rolls-Royce Holdings plc is a British multinational aerospace and defence company. The company designs, manufactures and distributes power systems for aviation along with other industries.
Key Players Covered in the Report
Some of the key players in the Zero Emission Aircraft Market are Airbus, Rolls-Royce plc, BYE AEROSPACE, HES Energy Systems, Aurora Flight Sciences (The Boeing Company), Eviation Alice and Lilium.
Recent developments by Key Players
Rolls Royce Plc has formalized the agreement with Azad Engineering in Hyderabad which produce and supply intricate components that are crucial for its defense aircraft engines.
Airbus India and The Indian Institute of Technology (IIT) Guwahati has signed a pact to establish a global training centre for aviation and logistics in Guwahati. Assam shall be positioned as a key logistics hub with this collaboration that shall provide skilled professionals in aerospace technology.
Segments Covered in the Report
Region Covered in the Report
- North America
- U.S.
- Canada
- Mexico
- Europe
- Germany
- U.K.
- France
- Italy
- Spain
- Russia
- Rest of Europe
- Asia-Pacific (APAC)
- China
- Japan
- South Korea
- India
- Australia
- Rest of APAC
- Latin America
- Brazil
- Argentina
- Rest of Latin America
- Middle East and Africa
- Turkey
- UAE
- Saudi Arabia
- South Africa
- Rest of MEA
.png "Zero Emission Aircraft Market Size")
Source: VynZ Research
1. Research Overview
1.1. The Report Offers
1.2. Market Coverage
1.2.1. By Type of Aircraft
1.2.2. By Propulsion Type
1.2.3. By Range
1.2.4. By Application
1.2.5. By Region
1.3. Research Phases
1.4. Limitations
1.5. Market Methodology
1.5.1. Data Sources
1.5.1.1. Primary Research
1.5.1.2. Secondary Research
1.5.2. Methodology
1.5.2.1. Data Exploration
1.5.2.2. Forecast Parameters
1.5.2.3. Data Validation
1.5.2.4. Assumptions
1.5.3. Study Period & Data Reporting Unit
2. Executive Summary
3. Industry Overview
3.1. Industry Dynamics
3.1.1. Market Growth Drivers
3.1.2. Market Restraints
3.1.3. Key Market Trends
3.1.4. Major Opportunities
3.2. Industry Ecosystem
3.2.1. Porter’s Five Forces Analysis
3.2.2. Recent Development Analysis
3.2.3. Value Chain Analysis
3.3. Competitive Insight
3.3.1. Competitive Position of Industry Players
3.3.2. Market Attractive Analysis
3.3.3. Market Share Analysis
4. Global Market Estimate and Forecast
4.1. Global Market Overview
4.2. Global Market Estimate and Forecast to 2030
5. Market Segmentation Estimate and Forecast
5.1. By Type of Aircraft
5.1.1. Battery Electric Aircraft
5.1.1.1. Market Definition
5.1.1.2. Market Estimation and Forecast to 2030
5.1.2. Hydrogen Fuel Cell Aircraft
5.1.2.1. Market Definition
5.1.2.2. Market Estimation and Forecast to 2030
5.1.3. Hybrid Electric Aircraft
5.1.3.1. Market Definition
5.1.3.2. Market Estimation and Forecast to 2030
5.1.4. Solar Electric Aircraft
5.1.4.1. Market Definition
5.1.4.2. Market Estimation and Forecast to 2030
5.2. By Propulsion Type
5.2.1. Hydrogen-Powered Aircraft
5.2.1.1. Market Definition
5.2.1.2. Market Estimation and Forecast to 2030
5.2.2. Electric Aircraft
5.2.2.1. Market Definition
5.2.2.2. Market Estimation and Forecast to 2030
5.2.3. Other Alternative Fuels
5.2.2.1. Market Definition
5.2.2.2. Market Estimation and Forecast to 2030
5.3 By Range
5.3.1. Short Haul Aircraft
5.3.1.1. Market Definition
5.3.1.2. Market Estimation and Forecast to 2030
5.3.2. Medium Haul Aircraft
5.3.2.1. Market Definition
5.3.2.2. Market Estimation and Forecast to 2030
5.3.3. Long Haul Aircraft
5.3.2.1. Market Definition
5.3.2.2. Market Estimation and Forecast to 2030
5.4. By Application
5.4.1. Passenger Transportation
5.4.1.1. Market Definition
5.4.1.2. Market Estimation and Forecast to 2030
5.4.2. Cargo & Freight
5.4.2.1. Market Definition
5.4.2.2. Market Estimation and Forecast to 2030
5.4.3. Military & Defense
5.4.3.1. Market Definition
5.4.3.2. Market Estimation and Forecast to 2030
6. North America Market Estimate and Forecast
6.1. By Type of Aircraft
6.2. By Propulsion Type
6.3. By Range
6.4. By Application
6.5.1. U.S. Market Estimate and Forecast
6.5.2. Canada Market Estimate and Forecast
6.5.3. Mexico Market Estimate and Forecast
7. Europe Market Estimate and Forecast
7.1. By Type of Aircraft
7.2. By Propulsion Type
7.3. By Range
7.4. By Application
7.5.1. Germany Market Estimate and Forecast
7.5.2. France Market Estimate and Forecast
7.5.3. U.K. Market Estimate and Forecast
7.5.4. Italy Market Estimate and Forecast
7.5.5. Spain Market Estimate and Forecast
7.5.6. Rest of Europe Market Estimate and Forecast
8. Asia-Pacific Market Estimate and Forecast
8.1. By Type of Aircraft
8.2. By Propulsion Type
8.3. By Range
8.4. By Application
8.5. By Country – China, Japan, India, South Korea, and Rest of Asia-Pacific
8.5.1. China Market Estimate and Forecast
8.5.2. Japan Market Estimate and Forecast
8.5.3. India Market Estimate and Forecast
8.5.4. South Korea Market Estimate and Forecast
8.5.5. Singapore Market Estimate and Forecast
8.5.6. Rest of Asia-Pacific Market Estimate and Forecast
9. Rest of the World (RoW) Market Estimate and Forecast
9.1. By Type of Aircraft
9.2. By Propulsion Type
9.3. By Range
9.4. By Application
9.5. By Country – Brazil, Saudi Arabia, South Africa, U.A.E., and Other Countries
9.5.1. Brazil Market Estimate and Forecast
9.5.2. Saudi Arabia Market Estimate and Forecast
9.5.3. South Africa Market Estimate and Forecast
9.5.4. Other Countries Market Estimate and Forecast
10. Company Profiles
10.1. Airbus
10.1.1. Snapshot
10.1.2. Overview
10.1.3. Offerings
10.1.4. Financial Insight
10.1.5. Recent Developments
10.2. Rolls-Royce plc
10.2.1. Snapshot
10.2.2. Overview
10.2.3. Offerings
10.2.4. Financial Insight
10.2.5. Recent Developments
10.3. BYE AEROSPACE
10.3.1. Snapshot
10.3.2. Overview
10.3.3. Offerings
10.3.4. Financial Insight
10.3.5. Recent Developments
10.4. HES Energy Systems
10.4.1. Snapshot
10.4.2. Overview
10.4.3. Offerings
10.4.4. Financial Insight
10.4.5. Recent Developments
10.5. Aurora Flight Sciences (The Boeing Company)
10.5.1. Snapshot
10.5.2. Overview
10.5.3. Offerings
10.5.4. Financial Insight
10.5.5. Recent Developments
10.6. Eviation Alice
10.6.1. Snapshot
10.6.2. Overview
10.6.3. Offerings
10.6.4. Financial Insight
10.6.5. Recent Developments
10.7. Lilium
10.7.1. Snapshot
10.7.2. Overview
10.7.3. Offerings
10.7.4. Financial Insight
10.7.5. Recent Developments
11. Appendix
11.1. Exchange Rates
11.2. Abbreviations
Note: Financial insight and recent developments of different companies are subject to the availability of information in the secondary domain.
List of Tables
Table 1 Aircraft Type s
Table 2 Study Periods
Table 3 Data Reporting Unit
Table 4 Global Zero Emission Aircraft Market Size, by Aircraft Type, 2018-2023 (USD Billion)
Table 5 Global Zero Emission Aircraft Market Size, by Aircraft Type, 2025-2030(USD Billion)
Table 6 Global Zero Emission Aircraft Market Size, by Propulsion Type, 2018-2023 (USD Billion)
Table 7 Global Zero Emission Aircraft Market Size, by Propulsion Type, 2025-2030(USD Billion)
Table 8 Global Zero Emission Aircraft Market Size, by Range, 2018-2023 (USD Billion)
Table 9 Global Zero Emission Aircraft Market Size, by Range, 2025-2030(USD Billion)
Table 10 Global Zero Emission Aircraft Market Size, by Application, 2018-2023 (USD Billion)
Table 11 Global Zero Emission Aircraft Market Size, by Application, 2025-2030(USD Billion)
Table 12 Global Zero Emission Aircraft Market Size, by Region, 2018-2023 (USD Billion)
Table 13 Global Zero Emission Aircraft Market Size, by Region, 2025-2030(USD Billion)
Table 14 North America Zero Emission Aircraft Market Size, by Aircraft Type, 2018-2023 (USD Billion)
Table 15 North America Zero Emission Aircraft Market Size, by Aircraft Type, 2025-2030(USD Billion)
Table 16 North America Zero Emission Aircraft Market Size, by Propulsion Type, 2018-2023 (USD Billion)
Table 17 North America Zero Emission Aircraft Market Size, by Propulsion Type, 2025-2030(USD Billion)
Table 18 North America Zero Emission Aircraft Market Size, by Range, 2018-2023 (USD Billion)
Table 19 North America Zero Emission Aircraft Market Size, by Range, 2025-2030(USD Billion)
Table 20 North America Zero Emission Aircraft Market Size, by Application, 2018-2023 (USD Billion)
Table 21 North America Zero Emission Aircraft Market Size, by Application, 2025-2030(USD Billion)
Table 22 North America Zero Emission Aircraft Market Size, by Country, 2018-2023 (USD Billion)
Table 23 North America Zero Emission Aircraft Market Size, by Country, 2025-2030(USD Billion)
Table 24 Europe Zero Emission Aircraft Market Size, by Aircraft Type, 2018-2023 (USD Billion)
Table 25 Europe Zero Emission Aircraft Market Size, by Aircraft Type, 2025-2030(USD Billion)
Table 26 Europe Zero Emission Aircraft Market Size, by Propulsion Type, 2018-2023 (USD Billion)
Table 27 Europe Zero Emission Aircraft Market Size, by Propulsion Type, 2025-2030(USD Billion)
Table 28 Europe Zero Emission Aircraft Market Size, by Range, 2018-2023 (USD Billion)
Table 29 Europe Zero Emission Aircraft Market Size, by Range, 2025-2030(USD Billion)
Table 30 Europe Zero Emission Aircraft Market Size, by Application, 2018-2023 (USD Billion)
Table 31 Europe Zero Emission Aircraft Market Size, by Application, 2025-2030(USD Billion)
Table 32 Europe Zero Emission Aircraft Market Size, by Country, 2018-2023 (USD Billion)
Table 33 Europe Zero Emission Aircraft Market Size, by Country, 2025-2030(USD Billion)
Table 34 Asia-Pacific Zero Emission Aircraft Market Size, by Aircraft Type, 2018-2023 (USD Billion)
Table 35 Asia-Pacific Zero Emission Aircraft Market Size, by Aircraft Type, 2025-2030(USD Billion)
Table 36 Asia-Pacific Zero Emission Aircraft Market Size, by Propulsion Type, 2018-2023 (USD Billion)
Table 37 Asia-Pacific Zero Emission Aircraft Market Size, by Propulsion Type, 2025-2030(USD Billion)
Table 38 Asia-Pacific Zero Emission Aircraft Market Size, by Range, 2018-2023 (USD Billion)
Table 39 Asia-Pacific Zero Emission Aircraft Market Size, by Range, 2025-2030(USD Billion)
Table 40 Asia-Pacific Zero Emission Aircraft Market Size, by Application, 2018-2023 (USD Billion)
Table 41 Asia-Pacific Zero Emission Aircraft Market Size, by Application, 2025-2030(USD Billion)
Table 42 Asia-Pacific Zero Emission Aircraft Market Size, by Country, 2018-2023 (USD Billion)
Table 43 Asia-Pacific Zero Emission Aircraft Market Size, by Country, 2025-2030(USD Billion)
Table 44 RoW Zero Emission Aircraft Market Size, by Aircraft Type, 2018-2023 (USD Billion)
Table 45 RoW Zero Emission Aircraft Market Size, by Aircraft Type, 2025-2030(USD Billion)
Table 46 RoW Zero Emission Aircraft Market Size, by Propulsion Type, 2018-2023 (USD Billion)
Table 47 RoW Zero Emission Aircraft Market Size, by Propulsion Type, 2025-2030(USD Billion)
Table 48 RoW Zero Emission Aircraft Market Size, by Range, 2018-2023 (USD Billion)
Table 49 RoW Zero Emission Aircraft Market Size, by Range, 2025-2030(USD Billion)
Table 50 RoW Zero Emission Aircraft Market Size, by Application, 2018-2023 (USD Billion)
Table 51 RoW Zero Emission Aircraft Market Size, by Application, 2025-2030(USD Billion)
Table 52 RoW Zero Emission Aircraft Market Size, by Country, 2018-2023 (USD Billion)
Table 54 RoW Zero Emission Aircraft Market Size, by Country, 2025-2030(USD Billion)
Table 55 Snapshot – Airbus
Table 56 Snapshot – Rolls-Royce plc
Table 57 Snapshot – BYE AEROSPACE
Table 58 Snapshot – HES Energy Systems
Table 59 Snapshot – Aurora Flight Sciences (The Boeing Company
Table 60 Snapshot – Eviation Alice
Table 61 Snapshot – Lilium
List of Figures
Figure 1 Market Coverage
Figure 2 Research Phases
Figure 3 Secondary Aircraft Types for Different Parameters
Figure 4 Methodology
Figure 5 Data Mining & Exploration
Figure 6 Data Triangulation
Figure 7 Assumptions for Market Estimation and Forecast
Figure 8 Market Synopsis
Figure 9 Global Zero Emission Aircraft Market - Growth Drivers and Restraints
Figure 10 Competitive Benchmark
Figure 11 Global Zero Emission Aircraft Market Highlight
Figure 12 Global Zero Emission Aircraft Market Size, by Aircraft Type, 2018 – 2030 (USD Billion)
Figure 13 Global Zero Emission Aircraft Market Size, by Propulsion Type2018 – 2030 (USD Billion)
Figure 14 Global Zero Emission Aircraft Market Size, by Range 2018 – 2030 (USD Billion)
Figure 15 Global Zero Emission Aircraft Market Size, by Application 2018 – 2030 (USD Billion)
Figure 16 Global Zero Emission Aircraft Market Size, by Region, 2018 – 2030 (USD Billion)
Figure 17 North America Zero Emission Aircraft Market Highlight
Figure 18 North America Zero Emission Aircraft Market Size, by Aircraft Type, 2018 – 2030 (USD Billion)
Figure 19 North America Zero Emission Aircraft Market Size, by Propulsion Type 2018–2030 (USD Billion)
Figure 20 North America Zero Emission Aircraft Market Size, by Range 2018–2030 (USD Billion)
Figure 21 North America Zero Emission Aircraft Market Size, by Application 2018–2030 (USD Billion)
Figure 22 North America Zero Emission Aircraft Market Size, by Country, 2018 – 2030 (USD Billion)
Figure 23 Europe Zero Emission Aircraft Market Highlight
Figure 24 Europe Zero Emission Aircraft Market Size, by Aircraft Type, 2018 – 2030 (USD Billion)
Figure 25 Europe Zero Emission Aircraft Market Size, by Propulsion Type 2018 – 2030 (USD Billion)
Figure 26 Europe Zero Emission Aircraft Market Size, by Range 2018 – 2030 (USD Billion)
Figure 27 Europe Zero Emission Aircraft Market Size, by Application 2018 – 2030 (USD Billion)
Figure 28 Europe Zero Emission Aircraft Market Size, by Country, 2018 – 2030 (USD Billion)
Figure 29 Asia-Pacific Zero Emission Aircraft Market Highlight
Figure 30 Asia-Pacific Zero Emission Aircraft Market Size, by Aircraft Type, 2018 – 2030 (USD Billion)
Figure 31 Asia-Pacific Zero Emission Aircraft Market Size, by Propulsion Type 2018 – 2030 (USD Billion)
Figure 32 Asia-Pacific Zero Emission Aircraft Market Size, by Range 2018 – 2030 (USD Billion)
Figure 33 Asia-Pacific Zero Emission Aircraft Market Size, by Application 2018 – 2030 (USD Billion)
Figure 34 Asia-Pacific Zero Emission Aircraft Market Size, by Country, 2018 – 2030 (USD Billion)
Figure 35 RoW Zero Emission Aircraft Market Highlight
Figure 36 RoW Zero Emission Aircraft Market Size, by Aircraft Type, 2018 – 2030 (USD Billion)
Figure 37 RoW Zero Emission Aircraft Market Size, by Propulsion Type 2018 – 2030 (USD Billion)
Figure 38 RoW Zero Emission Aircraft Market Size, by Range 2018 – 2030 (USD Billion)
Figure 39 RoW Zero Emission Aircraft Market Size, by Application 2018 – 2030 (USD Billion)
Figure 40 RoW Zero Emission Aircraft Market Size, by Country, 2018 – 2030 (USD Billion)
Global Zero Emission Aircraft Market Coverage
By Aircraft Type Insight and Forecast 2025-2030
- Battery Electric Aircraft
- Hydrogen Fuel Cell Aircraft
- Hybrid Electric Aircraft
- Solar Electric Aircraft
By Propulsion Type Insight and Forecast 2025-2030
- Hydrogen Powered Aircraft
- Electric Aircraft
- Other Alternative Fuels
By Range Insight and Forecast 2025-2030
- Short Haul Aircraft
- Medium Haul Aircraft
- Long Haul Aircraft
By Application Insight and Forecast 2025-2030
- Passenger Transportation
- Cargo & Freight
- Military & Defense
Global Zero Emission Aircraft Market by Region
North America
- By Aircraft Type
- By Propulsion Type
- By Range
- By Application
- By Country – U.S., Canada, and Mexico
Europe
- By Aircraft Type
- By Propulsion Type
- By Range
- By Application
- By Country – Germany, U.K., France, Italy, Spain, Russia, and Rest of Europe
Asia-Pacific (APAC)
- By Aircraft Type
- By Propulsion Type
- By Range
- By Application
- By Country – China, Japan, India, South Korea, and the Rest of Asia-Pacific
Rest of the World (RoW)
- By Aircraft Type
- By Propulsion Type
- By Range
- By Application
- By Country – Brazil, Saudi Arabia, South Africa, U.A.E., and Other Countries
About This Report
Purchase Options
Latest Report
Research Methodology
- Desk Research / Pilot Interviews
- Build Market Size Model
- Research and Analysis
- Final Deliverabvle
Connect With Our Sales Team
- Toll-Free: 1 888 253 3960
- Phone: +91 9960 288 381
- Email: enquiry@vynzresearch.com
Zero Emission Aircraft Market