Status : Published | Published On : Apr, 2024 | Report Code : VRAT4069 | Industry : Automotive & Transportation | Available Format : | Page : 203 |
Industry Overview
The Global Autonomous Vehicle Market size in terms of volume was USD 17.7 Billion in 2023 and is expected to reach USD 53.2 Billion by 2030, growing at a CAGR of 17.8% during 2025 – 2030. The growth of the autonomous vehicle market is attributed to the extensive development of an autonomous fleet of parcel and cab delivery services along with OTA updates availed for automotive software. Moreover, autonomous vehicles emit less amount of carbon dioxide and further eliminate accidents that are majorly occurring due to manual errors. Additionally, the low amount of consumption of gas and battery capacity by autonomous vehicles is another factor bolstering growth of the global autonomous vehicle market.
Autonomous vehicle are also known as self-driving or driverless car that is capable of sensing and observing the environment and further operates without any human input. Several key players are emphasizing their efforts and capabilities towards development of semi-autonomous or fully autonomous vehicles and is further contributing towards the growth of global autonomous vehicle market.
Market Segmentation
Insight by Level of Autonomy
On the basis of level of autonomy, the global autonomous vehicle market is categorized into level 1, level 2, level 3, level 4 and level 5. Amongst these levels of autonomy, level 1 is anticipated to generate largest revenue throughout the estimated period. The growth of this segment is attributed towards extensive demand for high end passenger cars that include various features such as lane departure warning, adaptive cruise control and drowsiness monitoring.
Report Metric |
Details |
Historical Period |
2018 - 2023 |
Base Year Considered |
2024 |
Forecast Period |
2025 - 2030 |
Market Size in 2023 |
U.S.D. 17.7 Billion Billion |
Revenue Forecast in 2030 |
U.S.D. 53.2 Billion Billion |
Growth Rate |
17.8%% |
Segments Covered in the Report |
By Level of Autonomy, By Vehicle Type |
Report Scope |
Market Trends, Drivers, and Restraints; Revenue Estimation and Forecast; Segmentation Analysis; Impact of COVID-19; Companies’ Strategic Developments; Market Share Analysis of Key Players; Company Profiling |
Regions Covered in the Report |
North America, Europe, Asia Pacific and Rest of the World |
Industry Dynamics
Industry Trends
Extensive integration of IoT driven by AI technology in automotive industry and rapid development and introduction of HD maps for autonomous vehicles are the key trends observed in the growth of global autonomous vehicle market. With the use of internet of things (IOT) assimilated automobile companies respond to real-time mechanical issues and update the software by further facilitating data communication system. In addition, IOT helps in improving the performance of the vehicle and helps the users in avoiding safety hazards along with accidents.
Growth Drivers
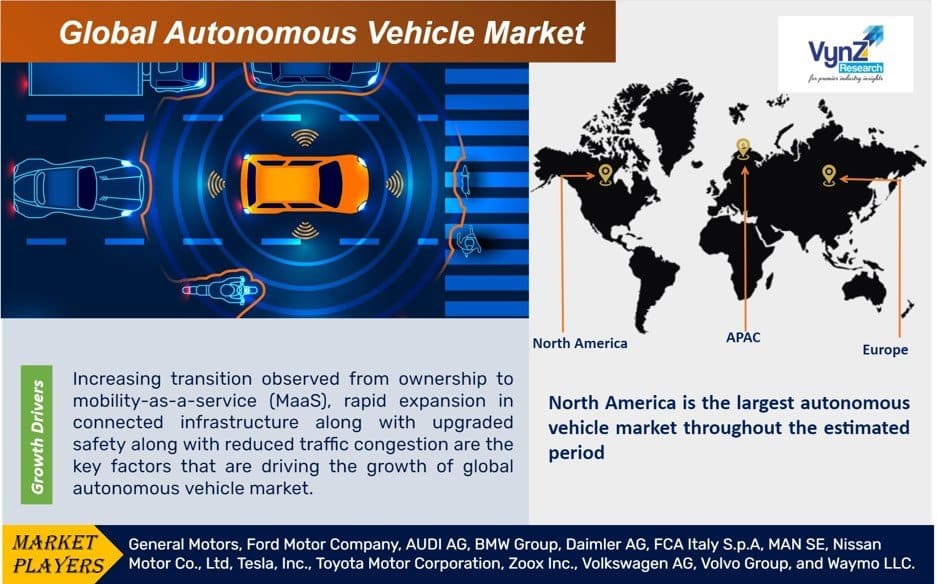
Increasing transition observed from ownership to mobility-as-a-service (MaaS), rapid expansion in connected infrastructure along with upgraded safety along with reduced traffic congestion are the key factors that are driving the growth of global autonomous vehicle market. Connected cars are gaining huge momentum globally from various domains such as consumer electronics companies, software vendors, automobile manufacturers or telecom operators. The connected vehicles utilize IoT, where several vehicles interact with each other. It also enables coordination with road infrastructure like traffic signals and send real-time alerts to the service center pertaining to the car condition.
Challenges
Increase in number of cyber threat cases due to increase of data along with unavailability of required infrastructure and indefinite legal responsibility are the key factors that are hampering the growth of global autonomous vehicle market.
Geographic Overview
Geographically, North America is the largest autonomous vehicle market throughout the estimated period. The growth of autonomous vehicle in this region is attributed towards extensive growth of economies that is enabling flourishing development from transport infrastructure to development of smart cities. There are several countries such as the U.S., Canada and Mexico are rapidly implementing digital infrastructure in order to facilitate easy connectivity between infrastructures and vehicles in order to gather crucial information that further leads to enhanced road safety along with reduced traffic congestion. Additionally, increasing initiatives from government, accessibility of high end infrastructure and increasing investments attained form the automakers are another factors that are pertaining towards the growth of autonomous vehicle market in this region.
Asia-Pacific is observed to witness highest CAGR during the forecast period as the government organizations in this region are facilitating the growth of electric vehicles. Furthermore, increasing development of parcel delivery services and autonomous fleet of cab are another factors that are driving the growth of autonomous vehicle market in Asia-Pacific.
Competitive Insight
Key players in the autonomous vehicle market are catering to the demand of these devices by investing in technologically advanced products in their product portfolio across the globe along with increasing their funding capability for research and development of autonomous vehicles their accentuating the global demand of this product.
Audi AG is a German automotive manufacturer of luxury vehicles headquartered in Ingolstadt, Bavaria, Germany. Audi produces vehicles in nine production facilities worldwide.
Bayerische Motoren Werke AG, commonly abbreviated to BMW, is a German multinational manufacturer of luxury vehicles and motorcycles headquartered in Munich, Bavaria. The new BMW 7 Series models shall feature the BMW Personal Pilot L3, which is a new function that opens up even more scope for the driver and can regulate speed, stopping distance and lane guidance.
Recent Developments by Key Players
Audi shall launch 20 new models by 2025 across categories to strengthen its global portfolio. Audi plans a major product offensive plan for the next two years and a massive capex programme for five years..
The BMW Group has collaborated with Eclipse Foundation’s Software Defined Vehicle (SDV) Working Group as a strategic member to develop open-source software for modern vehicles.
Some of the major players operating in the global autonomous vehicle market are General Motors, Ford Motor Company, AUDI AG, BMW Group, Daimler AG, FCA Italy S.p.A, MAN SE, Nissan Motor Co., Ltd, Tesla, Inc., Toyota Motor Corporation, Zoox Inc., Volkswagen AG, Volvo Group, and Waymo LLC.
Forecast Parameters
- Identifying variables and establishing market impact.
- Establishing market trends regionally.
- Analyzing opportunities and market penetration rates by understanding product commercialization, regional expansion.
- Analyzing demand and supply trends and changes in industry dynamics to establish future growth.
- Analyzing sustainability strategies adhered by market participants in an attempt to determine future course of the market.
- Analyzing historical market trends and super-imposing them on the current and future variables to determine the year-on-year trends.
- Understanding adoption, production, export, import and regulatory framework.
Data Validation
- Estimated and forecasted data was validated through industry experts.
- Apart from industry experts, data triangulation methods were used for validation.
- Bottom up and top-down approach has been used for estimation and forecast of market data, whereas top-down approach was used for validation.
- Demand, as well as supply-side surveys, were conducted in order to understand the industry dynamics and data validation.
Primary Research
VynZ Research conducts extensive primary research to understand the market dynamics, validate market data and have key opinions from the industry experts. The key profiles approached within the industry includes, CEO, CFO, CTO, President, Vice President, Product Managers, Regional Heads and Others. Also, end user surveys comprising of consumers are also conducted to understand consumer behaviour.
The Autonomous Vehicle Market report offers a comprehensive market segmentation analysis along with an estimation for the forecast period 2025–2030.
Segments Covered in the Report
Geographical Segmentation
Source: VynZ Research
1. Research Overview
1.1. The Report Offers
1.2. Market Coverage
1.2.1. By Level of Autonomy
1.2.2. By Vehicle Type
1.2.3. By Region
1.3. Research Phases
1.4. Limitations
1.5. Research Methodology
1.5.1. Data Sources
1.5.1.1. Primary Research
1.5.1.2. Secondary Research
1.5.2. Methodology
1.5.2.1. Data Exploration
1.5.2.2. Forecast Parameters
1.5.2.3. Data Validation
1.5.2.4. Assumptions
1.5.3. Study Period & Data Reporting Unit
2. Executive Summary
3. Industry Overview
3.1. Industry Dynamics
3.1.1. Market Growth Drivers
3.1.2. Market Restraints
3.1.3. Key Market Trends
3.1.4. Major Opportunities
3.2. Industry Ecosystem
3.2.1. Porter’s Five Forces Analysis
3.2.2. Recent Development Analysis
3.2.3. Value Chain Analysis
3.3. Competitive Insight
3.3.1. Competitive Position of Industry Players
3.3.2. Market Attractive Analysis
3.3.3. Market Share Analysis
4. Global Market Estimate and Forecast
4.1. Global Market Overview
4.2. Global Market Estimate and Forecast to 2030
5. Market Segmentation Estimate and Forecast
5.1. By Level of Autonomy
5.1.1. Level 1
5.1.1.1. Market Definition
5.1.1.2. Market Estimation and Forecast to 2030
5.1.2. Level 2
5.1.2.1. Market Definition
5.1.2.2. Market Estimation and Forecast to 2030
5.1.3. Level 3
5.1.3.1. Market Definition
5.1.3.2. Market Estimation and Forecast to 2030
5.1.4. Level 4
5.1.4.1. Market Definition
5.1.4.2. Market Estimation and Forecast to 2030
5.1.5. Level 5
5.1.5.1. Market Definition
5.1.5.2. Market Estimation and Forecast to 2030
5.2. By Vehicle Type
5.2.1. Commercial Vehicles
5.2.1.1. Market Definition
5.2.1.2. Market Estimation and Forecast to 2030
5.2.2. Passenger Vehicles
5.2.2.1. Market Definition
5.2.2.2. Market Estimation and Forecast to 2030
6. North America Market Estimate and Forecast
6.1. By Level of Autonomy
6.2. By Vehicle Type
6.3. By Country
6.3.1. U.S. Market Estimate and Forecast
6.3.2. Canada Market Estimate and Forecast
6.3.3. Mexico Market Estimate and Forecast
7. Europe Market Estimate and Forecast
7.1. By Level of Autonomy
7.2. By Vehicle Type
7.3. By Country
7.3.1. Germany Market Estimate and Forecast
7.3.2. France Market Estimate and Forecast
7.3.3. U.K. Market Estimate and Forecast
7.3.4. Italy Market Estimate and Forecast
7.3.5. Spain Market Estimate and Forecast
7.3.6. Russia Market Estimate and Forecast
7.3.7. Rest of Europe Market Estimate and Forecast
8. Asia-Pacific Market Estimate and Forecast
8.1. By Level of Autonomy
8.2. By Vehicle Type
8.3. By Country
8.3.1. China Market Estimate and Forecast
8.3.2. Japan Market Estimate and Forecast
8.3.3. India Market Estimate and Forecast
8.3.4. South Korea Market Estimate and Forecast
8.3.5. Rest of Asia-Pacific Market Estimate and Forecast
9. Rest of the World (RoW) Market Estimate and Forecast
9.1. By Level of Autonomy
9.2. By Vehicle Type
9.3. By Country
9.3.1. Brazil Market Estimate and Forecast
9.3.2. Saudi Arabia Market Estimate and Forecast
9.3.3. South Africa Market Estimate and Forecast
9.3.4. U.A.E. Market Estimate and Forecast
9.3.5. Other Countries Market Estimate and Forecast
10. Company Profiles
10.1. General Motors
10.1.1. Snapshot
10.1.2. Overview
10.1.3. Offerings
10.1.4. Financial Insight
10.1.5. Recent Developments
10.2. Ford Motor Company
10.2.1. Snapshot
10.2.2. Overview
10.2.3. Offerings
10.2.4. Financial Insight
10.2.5. Recent Developments
10.3. AUDI AG
10.3.1. Snapshot
10.3.2. Overview
10.3.3. Offerings
10.3.4. Financial Insight
10.3.5. Recent Developments
10.4. BMW Group
10.4.1. Snapshot
10.4.2. Overview
10.4.3. Offerings
10.4.4. Financial Insight
10.4.5. Recent Developments
10.5. Daimler AG
10.5.1. Snapshot
10.5.2. Overview
10.5.3. Offerings
10.5.4. Financial Insight
10.5.5. Recent Developments
10.6. FCA Italy S.p.A
10.6.1. Snapshot
10.6.2. Overview
10.6.3. Offerings
10.6.4. Financial Insight
10.6.5. Recent Developments
10.7. MAN SE
10.7.1. Snapshot
10.7.2. Overview
10.7.3. Offerings
10.7.4. Financial Insight
10.7.5. Recent Developments
10.8. Nissan Motor Co., Ltd
10.8.1. Snapshot
10.8.2. Overview
10.8.3. Offerings
10.8.4. Financial Insight
10.8.5. Recent Developments
10.9. Tesla, Inc.
10.9.1. Snapshot
10.9.2. Overview
10.9.3. Offerings
10.9.4. Financial Insight
10.9.5. Recent Developments
10.10. Toyota Motor Corporation
10.10.1. Snapshot
10.10.2. Overview
10.10.3. Offerings
10.10.4. Financial Insight
10.10.5. Recent Developments
10.11. Zoox Inc.
10.11.1. Snapshot
10.11.2. Overview
10.11.3. Offerings
10.11.4. Financial Insight
10.11.5. Recent Developments
10.12. Volkswagen AG
10.12.1. Snapshot
10.12.2. Overview
10.12.3. Offerings
10.12.4. Financial Insight
10.12.5. Recent Developments
10.13. Volvo Group
10.13.1. Snapshot
10.13.2. Overview
10.13.3. Offerings
10.13.4. Financial Insight
10.13.5. Recent Developments
10.14. Waymo LLC.
10.14.1. Snapshot
10.14.2. Overview
10.14.3. Offerings
10.14.4. Financial Insight
10.14.5. Recent Developments
11. Appendix
11.1. Exchange Rates
11.2. Abbreviations
Note: Financial insight and recent developments of different companies are subject to availability of information in secondary domain.
List of Tables
Table 1 Sources
Table 2 Study Periods
Table 3 Data Reporting Unit
Table 4 Global Autonomous Vehicle Market Size, by Level of Autonomy, 2018 – 2023 (Billion Units)
Table 5 Global Autonomous Vehicle Market Size, by Level of Autonomy, 2025 – 2030 (Billion Units)
Table 6 Global Autonomous Vehicle Market Size, by Level of Autonomy, 2018 – 2023 (USD Billion)
Table 7 Global Autonomous Vehicle Market Size, by Level of Autonomy, 2025 – 2030 (USD Billion)
Table 8 Global Autonomous Vehicle Market Size, by Vehicle Type, 2018 – 2023 (Billion Units)
Table 9 Global Autonomous Vehicle Market Size, by Vehicle Type, 2025 – 2030 (Billion Units)
Table 10 Global Autonomous Vehicle Market Size, by Vehicle Type, 2018 – 2023 (USD Billion)
Table 11 Global Autonomous Vehicle Market Size, by Vehicle Type, 2025 – 2030 (USD Billion)
Table 12 Global Autonomous Vehicle Market Size, by Region, 2018 – 2023 (Billion Units)
Table 13 Global Autonomous Vehicle Market Size, by Region, 2025 – 2030 (Billion Units)
Table 14 Global Autonomous Vehicle Market Size, by Region, 2018 – 2023 (USD Billion)
Table 15 Global Autonomous Vehicle Market Size, by Region, 2025 – 2030 (USD Billion)
Table 16 North America Autonomous Vehicle Market Size, by Level of Autonomy, 2018 – 2023 (Billion Units)
Table 17 North America Autonomous Vehicle Market Size, by Level of Autonomy, 2025 – 2030 (Billion Units)
Table 18 North America Autonomous Vehicle Market Size, by Level of Autonomy, 2018 – 2023 (USD Billion)
Table 19 North America Autonomous Vehicle Market Size, by Level of Autonomy, 2025 – 2030 (USD Billion)
Table 20 North America Autonomous Vehicle Market Size, by Vehicle Type, 2018 – 2023 (Billion Units)
Table 21 North America Autonomous Vehicle Market Size, by Vehicle Type, 2025 – 2030 (Billion Units)
Table 22 North America Autonomous Vehicle Market Size, by Vehicle Type, 2018 – 2023 (USD Billion)
Table 23 North America Autonomous Vehicle Market Size, by Vehicle Type, 2025 – 2030 (USD Billion)
Table 24 North America Autonomous Vehicle Market Size, by Country, 2018 – 2023 (Billion Units)
Table 25 North America Autonomous Vehicle Market Size, by Country, 2025 – 2030 (Billion Units)
Table 26 North America Autonomous Vehicle Market Size, by Country, 2018 – 2023 (USD Billion)
Table 27 North America Autonomous Vehicle Market Size, by Country, 2025 – 2030 (USD Billion)
Table 28 Europe Autonomous Vehicle Market Size, by Level of Autonomy, 2018 – 2023 (Billion Units)
Table 29 Europe Autonomous Vehicle Market Size, by Level of Autonomy, 2025 – 2030 (Billion Units)
Table 30 Europe Autonomous Vehicle Market Size, by Level of Autonomy, 2018 – 2023 (USD Billion)
Table 31 Europe Autonomous Vehicle Market Size, by Level of Autonomy, 2025 – 2030 (USD Billion)
Table 32 Europe Autonomous Vehicle Market Size, by Vehicle Type, 2018 – 2023 (Billion Units)
Table 33 Europe Autonomous Vehicle Market Size, by Vehicle Type, 2025 – 2030 (Billion Units)
Table 34 Europe Autonomous Vehicle Market Size, by Vehicle Type, 2018 – 2023 (USD Billion)
Table 35 Europe Autonomous Vehicle Market Size, by Vehicle Type, 2025 – 2030 (USD Billion)
Table 36 Europe Autonomous Vehicle Market Size, by Country, 2018 – 2023 (Billion Units)
Table 37 Europe Autonomous Vehicle Market Size, by Country, 2025 – 2030 (Billion Units)
Table 38 Europe Autonomous Vehicle Market Size, by Country, 2018 – 2023 (USD Billion)
Table 39 Europe Autonomous Vehicle Market Size, by Country, 2025 – 2030 (USD Billion)
Table 40 Asia-Pacific Autonomous Vehicle Market Size, by Level of Autonomy, 2018 – 2023 (Billion Units)
Table 41 Asia-Pacific Autonomous Vehicle Market Size, by Level of Autonomy, 2025 – 2030 (Billion Units)
Table 42 Asia-Pacific Autonomous Vehicle Market Size, by Level of Autonomy, 2018 – 2023 (USD Billion)
Table 43 Asia-Pacific Autonomous Vehicle Market Size, by Level of Autonomy, 2025 – 2030 (USD Billion)
Table 44 Asia-Pacific Autonomous Vehicle Market Size, by Vehicle Type, 2018 – 2023 (Billion Units)
Table 45 Asia-Pacific Autonomous Vehicle Market Size, by Vehicle Type, 2025 – 2030 (Billion Units)
Table 46 Asia-Pacific Autonomous Vehicle Market Size, by Vehicle Type, 2018 – 2023 (USD Billion)
Table 47 Asia-Pacific Autonomous Vehicle Market Size, by Vehicle Type, 2025 – 2030 (USD Billion)
Table 48 Asia-Pacific Autonomous Vehicle Market Size, by Country, 2018 – 2023 (Billion Units)
Table 49 Asia-Pacific Autonomous Vehicle Market Size, by Country, 2025 – 2030 (Billion Units)
Table 50 Asia-Pacific Autonomous Vehicle Market Size, by Country, 2018 – 2023 (USD Billion)
Table 51 Asia-Pacific Autonomous Vehicle Market Size, by Country, 2025 – 2030 (USD Billion)
Table 52 RoW Autonomous Vehicle Market Size, by Level of Autonomy, 2018 – 2023 (Billion Units)
Table 53 RoW Autonomous Vehicle Market Size, by Level of Autonomy, 2025 – 2030 (Billion Units)
Table 54 RoW Autonomous Vehicle Market Size, by Level of Autonomy, 2018 – 2023 (USD Billion)
Table 55 RoW Autonomous Vehicle Market Size, by Level of Autonomy, 2025 – 2030 (USD Billion)
Table 56 RoW Autonomous Vehicle Market Size, by Vehicle Type, 2018 – 2023 (Billion Units)
Table 57 RoW Autonomous Vehicle Market Size, by Vehicle Type, 2025 – 2030 (Billion Units)
Table 58 RoW Autonomous Vehicle Market Size, by Vehicle Type, 2018 – 2023 (USD Billion)
Table 59 RoW Autonomous Vehicle Market Size, by Vehicle Type, 2025 – 2030 (USD Billion)
Table 60 RoW Autonomous Vehicle Market Size, by Country, 2018 – 2023 (Billion Units)
Table 61 RoW Autonomous Vehicle Market Size, by Country, 2025 – 2030 (Billion Units)
Table 62 RoW Autonomous Vehicle Market Size, by Country, 2018 – 2023 (USD Billion)
Table 63 RoW Autonomous Vehicle Market Size, by Country, 2025 – 2030 (USD Billion)
Table 64 Snapshot – General Motors
Table 65 Snapshot – Ford Motor Company
Table 66 Snapshot – AUDI AG
Table 67 Snapshot – BMW Group
Table 68 Snapshot – Daimler AG
Table 69 Snapshot – FCA Italy S.p.A
Table 70 Snapshot – MAN SE
Table 71 Snapshot – Nissan Motor Co., Ltd
Table 72 Snapshot – Tesla, Inc.
Table 73 Snapshot – Toyota Motor Corporation
Table 74 Snapshot – Zoox Inc.
Table 75 Snapshot – Volkswagen AG
Table 76 Snapshot – Volvo Group
Table 77 Snapshot – Waymo LLC
List of Figures
Figure 1 Market Coverage
Figure 2 Research Phases
Figure 3 Secondary Sources for Different Parameters
Figure 4 Methodology
Figure 5 Data Mining & Exploration
Figure 6 Data Triangulation
Figure 7 Assumptions for Market Estimation and Forecast
Figure 8 Market Synopsis
Figure 9 Global Autonomous Vehicle Market - Growth Drivers and Restraints
Figure 10 Competitive Benchmark
Figure 11 Global Autonomous Vehicle Market Highlight
Figure 12 Global Autonomous Vehicle Market Size, by Level of Autonomy, 2018 - 2030 (Billion Units)
Figure 13 Global Autonomous Vehicle Market Size, by Level of Autonomy, 2018 - 2030 (USD Billion)
Figure 14 Global Autonomous Vehicle Market Size, by Vehicle Type, 2018 - 2030 (Billion Units)
Figure 15 Global Autonomous Vehicle Market Size, by Vehicle Type, 2018 - 2030 (USD Billion)
Figure 16 Global Autonomous Vehicle Market Size, by Region, 2018 - 2030 (Billion Units)
Figure 17 Global Autonomous Vehicle Market Size, by Region, 2018 - 2030 (USD Billion)
Figure 18 North America Autonomous Vehicle Market Highlight
Figure 19 North America Autonomous Vehicle Market Size, by Level of Autonomy, 2018 - 2030 (Billion Units)
Figure 20 North America Autonomous Vehicle Market Size, by Level of Autonomy, 2018 - 2030 (USD Billion)
Figure 21 North America Autonomous Vehicle Market Size, by Vehicle Type, 2018 - 2030 (Billion Units)
Figure 22 North America Autonomous Vehicle Market Size, by Vehicle Type, 2018 - 2030 (USD Billion)
Figure 23 North America Autonomous Vehicle Market Size, by Country, 2018 - 2030 (Billion Units)
Figure 24 North America Autonomous Vehicle Market Size, by Country, 2018 - 2030 (USD Billion)
Figure 25 Europe Autonomous Vehicle Market Highlight
Figure 26 Europe Autonomous Vehicle Market Size, by Level of Autonomy, 2018 - 2030 (Billion Units)
Figure 27 Europe Autonomous Vehicle Market Size, by Level of Autonomy, 2018 - 2030 (USD Billion)
Figure 28 Europe Autonomous Vehicle Market Size, by Vehicle Type, 2018 - 2030 (Billion Units)
Figure 29 Europe Autonomous Vehicle Market Size, by Vehicle Type, 2018 - 2030 (USD Billion)
Figure 30 Europe Autonomous Vehicle Market Size, by Country, 2018 - 2030 (Billion Units)
Figure 31 Europe Autonomous Vehicle Market Size, by Country, 2018 - 2030 (USD Billion)
Figure 32 Asia-Pacific Autonomous Vehicle Market Highlight
Figure 33 Asia-Pacific Autonomous Vehicle Market Size, by Level of Autonomy, 2018 - 2030 (Billion Units)
Figure 34 Asia-Pacific Autonomous Vehicle Market Size, by Level of Autonomy, 2018 - 2030 (USD Billion)
Figure 35 Asia-Pacific Autonomous Vehicle Market Size, by Vehicle Type, 2018 - 2030 (Billion Units)
Figure 36 Asia-Pacific Autonomous Vehicle Market Size, by Vehicle Type, 2018 - 2030 (USD Billion)
Figure 37 Asia-Pacific Autonomous Vehicle Market Size, by Country, 2018 - 2030 (Billion Units)
Figure 38 Asia-Pacific Autonomous Vehicle Market Size, by Country, 2018 - 2030 (USD Billion)
Figure 39 RoW Autonomous Vehicle Market Highlight
Figure 40 RoW Autonomous Vehicle Market Size, by Level of Autonomy, 2018 - 2030 (Billion Units)
Figure 41 RoW Autonomous Vehicle Market Size, by Level of Autonomy, 2018 - 2030 (USD Billion)
Figure 42 RoW Autonomous Vehicle Market Size, by Vehicle Type, 2018 - 2030 (Billion Units)
Figure 43 RoW Autonomous Vehicle Market Size, by Vehicle Type, 2018 - 2030 (USD Billion)
Figure 44 RoW Autonomous Vehicle Market Size, by Country, 2018 - 2030 (Billion Units)
Figure 45 RoW Autonomous Vehicle Market Size, by Country, 2018 - 2030 (USD Billion)
Global Autonomous Vehicle Market Coverage
Level of Autonomy Insight and Forecast 2025-2030
Vehicle Type Insight and Forecast 2025-2030
Geographical Segmentation
Autonomous Vehicle Market by Region
North America
Europe
Asia-Pacific (APAC)
Rest of the World (RoW)
Vynz Research know in your business needs, you required specific answers pertaining to the market, Hence, our experts and analyst can provide you the customized research support on your specific needs.
After the purchase of current report, you can claim certain degree of free customization within the scope of the research.
Please let us know, how we can serve you better with your specific requirements to your research needs. Vynz research promises for quick reversal for your current business requirements.