Status : Published | Published On : Mar, 2024 | Report Code : VRAT4014 | Industry : Automotive & Transportation | Available Format : | Page : 114 |
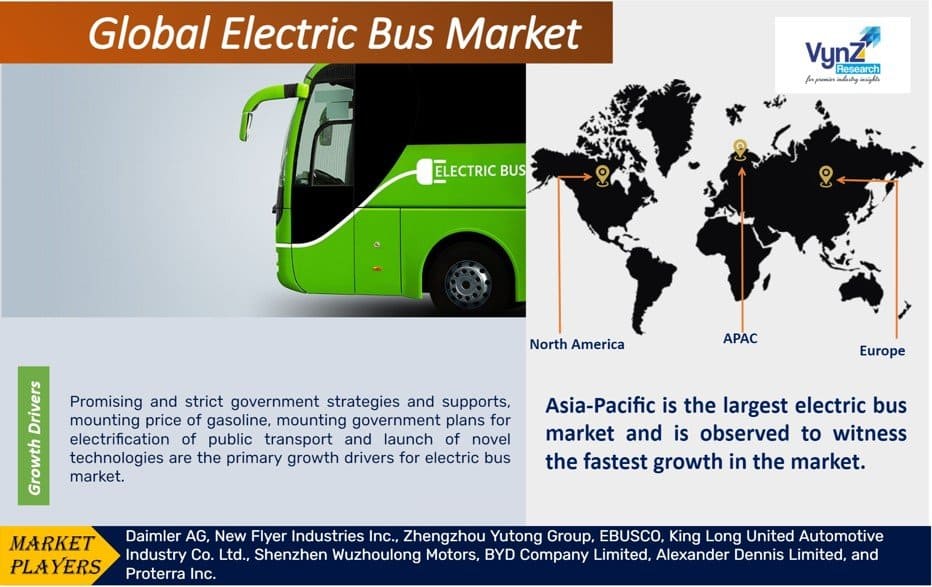
The global electric bus market is growing at 17.2% CAGR during the forecast period, with its fleet size anticipated to reach 283.3 thousand units by 2030. It is projected to reach USD 66.5 billion from USD 19.2 billion in 2023 within the forecast period.
The electric buses do not use fuel to operate and therefore do not emit harmful carbon to pollute the environment. There are different types of such vehicles, such as battery electric buses, hybrid electric buses, and plug-in hybrid electric buses. Though all are equally good, the battery electric buses are more in use and are highly preferred due to the lowering prices of batteries and low amount of carbon emissions.
The growth of this market is driven by favorable government initiatives as well as the growing concern over environmental pollution. Governments all over the globe are supporting the production and use of these vehicles to reduce greenhouse gas emissions. Technological advancements are also propelling the growth of the electric bus market.
Market Segmentation
Insight by Vehicle Type
According to the different types of vehicles, the global electric bus market is divided into battery electric buses, hybrid electric buses, and plug-in hybrid electric buses segments. Out of all these segments, the battery electric buses segment contributes to the larger share and is expected to grow at a faster rate during the forecast period. This is mainly due to the decreasing prices of batteries and lower carbon emissions.
Insight by Battery
According to the battery types, the global electric bus market is divided into lithium iron phosphate battery, lithium nickel manganese cobalt oxide, and other segments. Out of all these segments, the lithium iron phosphate battery segment accounts for the largest share of the market due to higher safety and cost-effectiveness.
However, the lithium nickel manganese cobalt oxide segment is also expected to grow during the forecast period at a faster rate due to lower prices and higher energy density.
Insight by Length
According to the length, the global electric bus market is divided into less than 10m and more than 10m. Among these two segments, the less than 10m segment accounts for the largest share of the market due to higher preference by the transport authority.
Insight by Application
According to the applications, the global electric bus market is divided into intercity and intracity. Among these two segments, the intercity segment dominates the market with a larger market share and is expected to grow continually during the forecast period due to the rise in demand for public transport as well as the rise in the number of people commuting to offices, schools, and universities all over the world.
The intracity segment is however expected to grow as well during the forecast period at a higher CAGR which is mainly due to the rising awareness among developing countries to reduce carbon emission levels. It is also attributed to the strict emission legislations imposed by the governments that push the adoption of electric buses.
Insight by End-Use
According to the end-use, the global electric bus market is divided into public and private. The public segment holds the larger share of the market which is mainly due to the significant rise in transportation demand as well as the introduction by the governments of several GHG emissions to reduce air and noise pollution and lower dependency on fossil fuels.
The private segment is also expected to grow during the forecast period at a higher CAGR due to the growing initiatives taken by several countries to deploy electric buses in their transportation system.
Report Metric |
Details |
Historical Period |
2018 - 2023 |
Base Year Considered |
2024 |
Forecast Period |
2025 - 2030 |
Market Size in 2023 |
U.S.D. 19.2 Billion |
Revenue Forecast in 2030 |
U.S.D. 283.3 Billion |
Growth Rate |
17.2% |
Segments Covered in the Report |
by Vehicle Type,by Battery,by Length |
Report Scope |
Market Trends, Drivers, and Restraints; Revenue Estimation and Forecast; Segmentation Analysis; Impact of COVID-19; Companies’ Strategic Developments; Market Share Analysis of Key Players; Company Profiling |
Regions Covered in the Report |
North America,Europe,Asia-Pacific (APAC),Rest of the World (RoW) |
Industry Dynamics
Growth Drivers
Several factors drive the growth of the global electric bus market. However, the most significant factor is the rising support for these vehicles by governments across the globe and the rising need for reducing greenhouse gas emissions.
The strategies and support by the governments are both strict yet promising, which drives the growth of this market. The plans of the governments for the electrification of public transport will also induce more electric buses into the system.
Add to that, the rising price of gasoline is also encouraging a shift to electric buses than traditional fuel-based buses.
The advancement in technologies and their launch in addition to the increased need for more efficient vehicles with zero carbon emission also propels the growth of the global electric bus market. The governments are also very strict on vehicle emissions and have imposed several severe regulations, which have also fueled the growth of this market.
Also, over the years there has been a significant increase in air pollution due to the fuel-based buses raising concerns over environmental pollution and negative impacts. This has also contributed to the growth of the global electric bus market.
Some other significant factors that propel the growth of this market are the lower cost of lithium-ion batteries, the development and rise in the number of charging infrastructure, and less maintenance requirements due to less noise.
Trends
The major players in the industry all over the globe are launching new products. This is leveraging the growth of the global electric bus market.
A lot of money is invested by the industry players for research and development of better battery technology that will be both energy-efficient and cost-efficient, which will, in turn, lower the cost and enhance the performance of electric buses.
Challenges
The lack of standardization, shorter lifecycle of the battery, inadequate charging infrastructure, high manufacturing cost, and stringent rules for the installation of charging stations are the major obstacles to the growth of the electric bus market. However, technological and infrastructural improvements and favorable support by the governments are changing the scenario and facilitating the growth of the global electric bus market.
Industry Ecosystem
Globally industry players are leveraging market growth through launching new products. Different players are investing in the development of new battery technology to lower the cost of electric buses to compete against gasoline buses in terms of price and performance. In the coming years, industry leaders are anticipated to significantly lower the cost of these vehicles and enhance the performance of these vehicles leading to adoption by the masses.
Geographic Overview
Asia-Pacific is the largest contributor to the electric bus market. It is also expected to grow at a faster rate during the forecast period due to rising government initiatives and support for these vehicles. In addition, the growing population base in this region along with the increase in air pollution also fuels the need for using these buses.
Furthermore, the growing concern over environmental impact and safety, reducing the cost of batteries, rising disposable income, rapid urbanization, increasing gasoline price, and growing need for zero carbon emission and efficient vehicles, are also fueling the growth of the global electric bus market in this region.
On the other hand, the European market is expected to grow at a higher CAGR during the forecast period due to favorable government policies and increasing efforts in reducing vehicle emissions. Furthermore, governments in this region have also taken initiatives to deploy green transportation technologies in their public transportation system to make it more sustainable and safer, which will push the market further forward.
Competitive Insight
Major players in the electric bus market are catering to the demand by collaborating with small players and investing in technologically advanced product portfolios across the globe. In October 2017, Proterra introduced the DuoPower drivetrain for its Catalyst zero-emission buses at the American Public Transit Association (APTA). Daimler AG, New Flyer Industries Inc., Zhengzhou Yutong Group, EBUSCO, King Long United Automotive Industry Co. Ltd., Shenzhen Wuzhoulong Motors, BYD Company Limited, Alexander Dennis Limited, and Proterra Inc. are the key players offering electric bus.
Recent Developments by Key Players
Daimler Buses Solutions (the latest subsidiary of Daimler Buses) shall be electrifying the bus depot of HTM Personenvervoer NV in The Hague. The project will cover the entire e-system and the installation of 41 charging stations with a total of 122 charging points, providing the charging management.
The Toronto Transit Commission (TTC) has collaborated with the North American manufacturer New Flyer for the delivery of up to 621 battery buses. The order is for 186 units of New Flyer’s Xcelsior Charge NG model with a length of 40 feet (about 12 metres).
The Electric Bus Market report offers a comprehensive market segmentation analysis along with an estimation for the forecast period 2025–2030.
Segments Covered in the Report
Geographical Segmentation
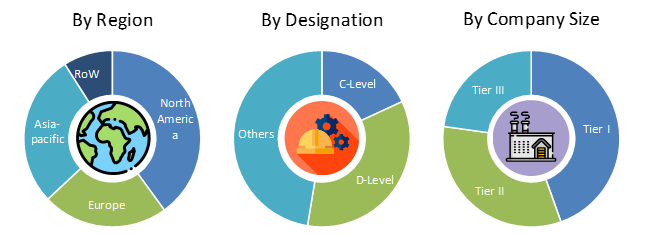
PRIMARY RESEARCH INTERVIEWS - BREAKDOWN
1. Research Overview
1.1. The Report Offers
1.2. Market Coverage
1.2.1. By Vehicle Type
1.2.2. By Battery
1.2.3. By Length
1.2.4. By Application
1.2.5. By End-Use
1.2.6. By Region
1.3. Research Phases
1.4. Limitations
1.5. Market Methodology
1.5.1. Data Sources
1.5.1.1. Primary Research
1.5.1.2. Secondary Research
1.5.2. Methodology
1.5.2.1. Data Exploration
1.5.2.2. Forecast Parameters
1.5.2.3. Data Validation
1.5.2.4. Assumptions
1.5.3. Study Period & Data Reporting Unit
2. Executive Summary
3. End-user Type Overview
3.1. End-user Type Dynamics
3.1.1. Market Growth Drivers
3.1.2. Market Restraints
3.1.3. Key Market Trends
3.1.4. Major Opportunities
3.2. End-user Type Ecosystem
3.2.1. Porter’s Five Forces Analysis
3.2.2. Recent Development Analysis
3.2.3. Value Chain Analysis
3.3. Competitive Insight
3.3.1. Competitive Position of End-user Type Players
3.3.2. Market Attractive Analysis
3.3.3. Market Share Analysis
4. Global Market Estimate and Forecast
4.1. Global Market Overview
4.2. Global Market Estimate and Forecast to 2030
5. Market Segmentation Estimate and Forecast
5.1. By Vehicle Type
5.1.1. Battery Electric Bus
5.1.1.1. Market Definition
5.1.1.2. Market Estimation and Forecast to 2030
5.1.2 Hybrid Electric Bus
5.1.2.1. Market Definition
5.1.2.2. Market Estimation and Forecast to 2030
5.1.3. Plug-In Hybrid Electric Bus
5.1.3.1. Market Definition
5.1.3.2. Market Estimation and Forecast to 2030
5.2. By Battery
5.2.1. Lithium Iron Phosphate Battery
5.2.1.1. Market Definition
5.2.1.2. Market Estimation and Forecast to 2030
5.2.2. Lithium Nickel Manganese Cobalt Oxide
5.2.1.1. Market Definition
5.2.1.2. Market Estimation and Forecast to 2030
5.3 By Length
5.3.1. Less than 10m and More than 10m
5.3.1.1. Market Definition
5.3.1.2. Market Estimation and Forecast to 2030
5.4. By Application
5.4.1. Intercity
5.4.1.1. Market Definition
5.4.1.2. Market Estimation and Forecast to 2030
5.4.2. Intracity
5.4.1.1. Market Definition
5.4.1.2. Market Estimation and Forecast to 2030
5.5. By End-Use
5.5.1. public
5.5.1.1. Market Definition
5.5.1.2. Market Estimation and Forecast to 2030
5.5.2. private
5.5.2.1. Market Definition
5.5.2.2. Market Estimation and Forecast to 2030
6. North America Market Estimate and Forecast
6.1. By Vehicle Type
6.2. By Battery
6.3. By Length
6.4. By Application
6.5. By End-Use
6.6. By Country – China, Japan, India, South Korea, and Rest of Asia-Pacific
6.6.1. U.S. Market Estimate and Forecast
6.6.2. Canada Market Estimate and Forecast
6.6.3. Mexico Market Estimate and Forecast
7. Europe Market Estimate and Forecast
7.1. By Vehicle Type
7.2. By Battery
7.3. By Length
7.4. By Application
7.5. By End-Use
7.6. By Country – China, Japan, India, South Korea, and Rest of Asia-Pacific
7.6.1. Germany Market Estimate and Forecast
7.6.2. France Market Estimate and Forecast
7.6.3. U.K. Market Estimate and Forecast
7.6.4. Italy Market Estimate and Forecast
7.6.5. Spain Market Estimate and Forecast
7.6.6. Rest of Europe Market Estimate and Forecast
8. Asia-Pacific Market Estimate and Forecast
8.1. By Vehicle Type
8.2. By Battery
8.3. By Length
8.4. By Application
8.5. By End-Use
8.6. By Country – China, Japan, India, South Korea, and Rest of Asia-Pacific
8.6.1. China Market Estimate and Forecast
8.6.2. Japan Market Estimate and Forecast
8.6.3. India Market Estimate and Forecast
8.6.4. South Korea Market Estimate and Forecast
8.6.5. Singapore Market Estimate and Forecast
8.6.6. Rest of Asia-Pacific Market Estimate and Forecast
9. Rest of the World (RoW) Market Estimate and Forecast
9.1. By Vehicle Type
9.2. By Battery
9.3. By Length
9.4. By Application
9.5. By End-Use
9.6. By Country – Brazil, Saudi Arabia, South Africa, U.A.E., and Other Countries
9.6.1. Brazil Market Estimate and Forecast
9.6.2. Saudi Arabia Market Estimate and Forecast
9.6.3. South Africa Market Estimate and Forecast
9.6.4. Other Countries Market Estimate and Forecast
10. Company Profiles
9.1. Daimler AG
9.1.1. Snapshot
9.1.2. Overview
9.1.3. Offerings
9.1.4. Financial Insight
9.1.5. Recent Developments
9.2. New Flyer Industries Inc.
9.2.1. Snapshot
9.2.2. Overview
9.2.3. Offerings
9.2.4. Financial Insight
9.2.5. Recent Developments
9.3. Zhengzhou Yutong Group
9.3.1. Snapshot
9.3.2. Overview
9.3.3. Offerings
9.3.4. Financial Insight
9.3.5. Recent Developments
9.4. EBUSCO
9.4.1. Snapshot
9.4.2. Overview
9.4.3. Offerings
9.4.4. Financial Insight
9.4.5. Recent Developments
9.5. King Long United Automotive Industry Co. Ltd.
9.5.1. Snapshot
9.5.2. Overview
9.5.3. Offerings
9.5.4. Financial Insight
9.5.5. Recent Developments
9.6. Shenzhen Wuzhoulong Motors
9.6.1. Snapshot
9.6.2. Overview
9.6.3. Offerings
9.6.4. Financial Insight
9.6.5. Recent Developments
9.7. BYD Company Limited
9.7.1. Snapshot
9.7.2. Overview
9.7.3. Offerings
9.7.4. Financial Insight
9.7.5. Recent Developments
9.8. Alexander Dennis Limited
9.8.1. Snapshot
9.8.2. Overview
9.8.3. Offerings
9.8.4. Financial Insight
9.8.5. Recent Developments
9.9. Proterra Inc.
9.9.1. Snapshot
9.9.2. Overview
9.9.3. Offerings
9.9.4. Financial Insight
9.9.5. Recent Developments
10. Appendix
10.1. Exchange Rates
10.2. Abbreviations
Note: Financial insights and recent developments are subject to the availability of information in the secondary domain.
List of Tables
Table 1 Vehicle Types
Table 2 Study Periods
Table 3 Data Reporting Unit
Table 4 Global Electric Bus Market Size, by Vehicle Type, 2018-2023 (USD Billion)
Table 5 Global Electric Bus Market Size, by Vehicle Type, 2025-2030 (USD Billion)
Table 6 Global Electric Bus Market Size, by Battery, 2018-2023 (USD Billion)
Table 7 Global Electric Bus Market Size, by Battery, 2025-2030 (USD Billion)
Table 8 Global Electric Bus Market Size, by Length, 2018-2023 (USD Billion)
Table 9 Global Electric Bus Market Size, by Length, 2025-2030 (USD Billion)
Table 10 Global Electric Bus Market Size, by Application, 2018-2023 (USD Billion)
Table 11 Global Electric Bus Market Size, by Application, 2025-2030 (USD Billion)
Table 12 Global Electric Bus Market Size, by End-Use, 2018-2023 (USD Billion)
Table 13Global Electric Bus Market Size, by End-Use, 2025-2030 (USD Billion)
Table 14 Global Electric Bus Market Size, by Region, 2018-2023 (USD Billion)
Table 15 Global Electric Bus Market Size, by Region, 2025-2030 (USD Billion)
Table 16 North America Electric Bus Market Size, by Vehicle Type, 2018-2023 (USD Billion)
Table 17 North America Electric Bus Market Size, by Vehicle Type, 2025-2030 (USD Billion)
Table 18 North America Electric Bus Market Size, by Battery, 2018-2023 (USD Billion)
Table 19 North America Electric Bus Market Size, by Battery, 2025-2030 (USD Billion)
Table 20 North America Electric Bus Market Size, by Length, 2018-2023 (USD Billion)
Table 21 North America Electric Bus Market Size, by Length, 2025-2030 (USD Billion)
Table 22 North America Electric Bus Market Size, by Application, 2018-2023 (USD Billion)
Table 23 North America Electric Bus Market Size, by Application, 2025-2030 (USD Billion)
Table 24 North America Electric Bus Market Size, by End-Use, 2018-2023 (USD Billion)
Table 25 North America Electric Bus Market Size, by End-Use, 2025-2030 (USD Billion)
Table 26 North America Electric Bus Market Size, by Country, 2018-2023 (USD Billion)
Table 27 North America Electric Bus Market Size, by Country, 2025-2030 (USD Billion)
Table 28 Europe Electric Bus Market Size, by Vehicle Type, 2018-2023 (USD Billion)
Table 29 Europe Electric Bus Market Size, by Vehicle Type, 2025-2030 (USD Billion)
Table 30 Europe Electric Bus Market Size, by Battery, 2018-2023 (USD Billion)
Table 31 Europe Electric Bus Market Size, by Battery, 2025-2030 (USD Billion)
Table 32 Europe Electric Bus Market Size, by Length, 2018-2023 (USD Billion)
Table 33 Europe Electric Bus Market Size, by Length, 2025-2030 (USD Billion)
Table 34 Europe Electric Bus Market Size, by Application, 2018-2023 (USD Billion)
Table 35 Europe Electric Bus Market Size, by Application, 2025-2030 (USD Billion)
Table 36 Europe Electric Bus Market Size, by End-Use, 2018-2023 (USD Billion)
Table 37 Europe Electric Bus Market Size, by End-Use, 2025-2030 (USD Billion)
Table 38 Europe Electric Bus Market Size, by Country, 2018-2023 (USD Billion)
Table 39 Europe Electric Bus Market Size, by Country, 2025-2030 (USD Billion)
Table 40 Asia-Pacific Electric Bus Market Size, by Vehicle Type, 2018-2023 (USD Billion)
Table 41 Asia-Pacific Electric Bus Market Size, by Vehicle Type, 2025-2030 (USD Billion)
Table 42 Asia-Pacific Electric Bus Market Size, by Battery, 2018-2023 (USD Billion)
Table 43 Asia-Pacific Electric Bus Market Size, by Battery, 2025-2030 (USD Billion)
Table 44 Asia-Pacific Electric Bus Market Size, by Length, 2018-2023 (USD Billion)
Table 45 Asia-Pacific Electric Bus Market Size, by Length, 2025-2030 (USD Billion)
Table 46 Europe Electric Bus Market Size, by Application, 2018-2023 (USD Billion)
Table 47 Europe Electric Bus Market Size, by Application, 2025-2030 (USD Billion)
Table 48 Europe Electric Bus Market Size, by End-Use, 2018-2023 (USD Billion)
Table 49 Europe Electric Bus Market Size, by End-Use, 2025-2030 (USD Billion)
Table 50 Asia-Pacific Electric Bus Market Size, by Country, 2018-2023 (USD Billion)
Table 51 Asia-Pacific Electric Bus Market Size, by Country, 2025-2030 (USD Billion)
Table 52 RoW Electric Bus Market Size, by Vehicle Type, 2018-2023 (USD Billion)
Table 53 RoW Electric Bus Market Size, by Vehicle Type, 2025-2030 (USD Billion)
Table 54 RoW Electric Bus Market Size, by Battery, 2018-2023 (USD Billion)
Table 55 RoW Electric Bus Market Size, by Battery, 2025-2030 (USD Billion)
Table 56 RoW Electric Bus Market Size, by Length, 2018-2023 (USD Billion)
Table 57 RoW Electric Bus Market Size, by Length, 2025-2030 (USD Billion)
Table 58 RoW Electric Bus Market Size, by Application, 2018-2023 (USD Billion)
Table 59 RoW Electric Bus Market Size, by Application, 2025-2030 (USD Billion)
Table 60 RoW Electric Bus Market Size, by End-Use, 2018-2023 (USD Billion)
Table 61 RoW Electric Bus Market Size, by End-Use, 2025-2030 (USD Billion)
Table 62 RoW Electric Bus Market Size, by Country, 2018-2023 (USD Billion)
Table 63 RoW Electric Bus Market Size, by Country, 2025-2030 (USD Billion)
Table 64 Snapshot – Daimler AG
Table 65 Snapshot – New Flyer Industries Inc.
Table 66 Snapshot – Zhengzhou Yutong Group
Table 67 Snapshot – EBUSCO
Table 68 Snapshot – King Long United Automotive Industry Co. Ltd.
Table 69 Snapshot – Shenzhen Wuzhoulong Motors
Table 70 Snapshot – BYD Company Limited
Table 71 Snapshot – Alexander Dennis Limited
Table 72 Snapshot – Proterra Inc.
List of Figures
Figure 1 Market Coverage
Figure 2 Research Phases
Figure 3 Secondary Vehicle Types for Different Parameters
Figure 4 Methodology
Figure 5 Data Mining & Exploration
Figure 6 Data Triangulation
Figure 7 Assumptions for Market Estimation and Forecast
Figure 8 Market Synopsis
Figure 9 Global Electric Bus Market - Growth Drivers and Restraints
Figure 10 Competitive Benchmark
Figure 11 Global Electric Bus Market Highlight
Figure 12 Global Electric Bus Market Size, by Vehicle Type, 2018 – 2030 (USD Billion)
Figure 13 Global Electric Bus Market Size, by Battery 2018 – 2030 (USD Billion)
Figure 14 Global Electric Bus Market Size, by Length 2018 – 2030 (USD Billion)
Figure 15 Global Electric Bus Market Size, by Application 2018 – 2030 (USD Billion)
Figure 16 Global Electric Bus Market Size, by End-Use 2018 – 2030 (USD Billion)
Figure 17 Global Electric Bus Market Size, by Region, 2018 – 2030 (USD Billion)
Figure 18 North America Electric Bus Market Highlight
Figure 19 North America Electric Bus Market Size, by Vehicle Type, 2018 – 2030 (USD Billion)
Figure 20 North America Electric Bus Market Size, by Battery 2018–2030 (USD Billion)
Figure 21 North America Electric Bus Market Size, by Length 2018–2030 (USD Billion)
Figure 22 North America Electric Bus Market Size, by Application 2018–2030 (USD Billion)
Figure 23 Global Electric Bus Market Size, by End-Use 2018 – 2030 (USD Billion)
Figure 24 North America Electric Bus Market Size, by Country, 2018 – 2030 (USD Billion)
Figure 25 Europe Electric Bus Market Highlight
Figure 26 Europe Electric Bus Market Size, by Vehicle Type, 2018 – 2030 (USD Billion)
Figure 27 Europe Electric Bus Market Size, by Battery 2018 – 2030 (USD Billion)
Figure 28 Europe Electric Bus Market Size, by Length 2018 – 2030 (USD Billion)
Figure 29 Europe Electric Bus Market Size, by Application 2018 – 2030 (USD Billion)
Figure 30 Global Electric Bus Market Size, by End-Use 2018 – 2030 (USD Billion)
Figure 31 Europe Electric Bus Market Size, by Country, 2018 – 2030 (USD Billion)
Figure 32 Asia-Pacific Electric Bus Market Highlight
Figure 33 Asia-Pacific Electric Bus Market Size, by Vehicle Type, 2018 – 2030 (USD Billion)
Figure 34 Asia-Pacific Electric Bus Market Size, by Battery 2018 – 2030 (USD Billion)
Figure 35 Asia-Pacific Electric Bus Market Size, by Length 2018 – 2030 (USD Billion)
Figure 36 Asia-Pacific Electric Bus Market Size, by Application 2018 – 2030 (USD Billion)
Figure 37 Global Electric Bus Market Size, by End-Use 2018 – 2030 (USD Billion)
Figure 38 Asia-Pacific Electric Bus Market Size, by Country, 2018 – 2030 (USD Billion)
Figure 39 RoW Electric Bus Market Highlight
Figure 40 RoW Electric Bus Market Size, by Vehicle Type, 2018 – 2030 (USD Billion)
Figure 41 RoW Electric Bus Market Size, by Battery 2018 – 2030 (USD Billion)
Figure 42 RoW Electric Bus Market Size, by Length 2018 – 2030 (USD Billion)
Figure 43 RoW Electric Bus Market Size, by Application 2018 – 2030 (USD Billion)
Figure 44 Global Electric Bus Market Size, by End-Use 2018 – 2030 (USD Billion)
Figure 45 RoW Electric Bus Market Size, by Country, 2018 – 2030 (USD Billion)
Electric Bus Market Coverage
Vehicle Type Insight and Forecast 2025-2030
Battery Insight and Forecast 2025-2030
Length Insight and Forecast 2025-2030
Application Insight and Forecast 2025-2030
End-Use Insight and Forecast 2025-2030
Global Electric Bus Market by Region
North America
Europe
Asia-Pacific (APAC)
Rest of the World (RoW)
Vynz Research know in your business needs, you required specific answers pertaining to the market, Hence, our experts and analyst can provide you the customized research support on your specific needs.
After the purchase of current report, you can claim certain degree of free customization within the scope of the research.
Please let us know, how we can serve you better with your specific requirements to your research needs. Vynz research promises for quick reversal for your current business requirements.