- 1-888-253-3960
- enquiry@vynzresearch.com
-
This is lorem ipsum doller
Electric Vehicle Aftermarket
| Status : Published | Published On : Feb, 2024 | Report Code : VRAT9627 | Industry : Automotive & Transportation | Available Format :

|
Page : 195 |
Global Electric Vehicle Aftermarket – Analysis and Forecast (2025-2030)
Industry Insights By Replacement Part (Tire, Battery, Brake Parts, Filters, Body Parts, Lighting and Electronic Components, Wheels, Turbochargers and Others), By Propulsion Type (Battery Electric Vehicles, Hybrid Electric Vehicles, Fuel Cell Electric Vehicles and Plug-in Hybrid Electric Vehicles), By Vehicle Type (Passenger Cars and Commercial Vehicles), By Certification Type (Genuine Parts, Certified Parts and Uncertified Parts), By Distribution Channel (Authorized Service Centers (OEMs), Premium Multi-brand Service Centers, Digital Aggregators and Others), and Geography (U.S., Canada, Germany, U.K., France, China, Japan, India, and Rest of the World)
Industry Overview
The global electric vehicle aftermarket industry is projected to reach USD 0.21 Billion by 2030 from USD 0.06 Billion in 2023, growing at a CAGR of 19.87% during the forecast period 2025-2030.
The global market for electric vehicles is growing rapidly, but their internal combustion engine-powered equivalents will require timely, efficient servicing and repair as they age. This represents an enormous opportunity for the aftermarket, but significantly only for garages that have invested in the equipment and know-how to work safely on these electric vehicles. Global electric vehicle sales grew from 2017 to 2018. While car sales may have collapsed in the first quarter of 2020, Europe and China have strongly supported a green recovery with growth in the electric vehicle sector.
The automobile industry is ahead of schedule on approaching the tipping point of when it will be as cheap (and realistic) to own an electric vehicle as one with an internal combustion engine. As projected prices of battery packs drop, this industry will now reach US $ 100/KWh a year earlier by 2024.
The ecosystem of products, services, and solutions that cater to the needs of electric vehicle (EV) owners beyond the original manufacturer's offerings is the electric vehicle aftermarket. Due to their environmentally friendly and cost-efficient nature, the electric vehicle aftermarket has emerged to provide various enhancements and modifications.
EV owners often turn to the aftermarket to personalize their vehicles, extend their range, improve charging infrastructure at home, or enhance overall performance. A wide range of components and services, including charging solutions, battery upgrades, performance tuning, interior customization, and maintenance services as electric vehicles gain prominence in the automotive industry. The companies specializing in the electric vehicle aftermarket focus on addressing the unique requirements of EVs, which contributes to the growth and innovation of this sector.
The Global Electric Vehicle Aftermarket is driven by the increasing demand for software-oriented aftermarket enterprises specializing in digital solutions. A notable market impetus arises from several original equipment manufacturers (OEMs) capitalizing on exclusive access to EV-specific components. Also, the rise of sizable independent aftermarket (IAM) intermediaries has significantly contributed to the escalating demand. The transformation from reactive to proactive and prescriptive maintenance practices is an additional force propelling the global market forward, uplifting brand loyalty and customer satisfaction.
Market Segmentation
Insight by Replacement Part
Based on replacement parts, The Global Electric Vehicle Aftermarket is segmented into Tire, Battery, Brake Parts, Filters, Body Parts, Lighting and Electronic Components, Wheels, Turbochargers and Others. Tire segment dominates the market as EV manufacturers often prioritize efficiency and range, prompting aftermarket tire manufacturers to develop specialized low-rolling-resistance tires that help maximize an EV's distance on a single charge.
Insight by Propulsion Type
The Global Battery Electric Vehicle Aftermarket is segmented into Battery Electric Vehicles, Hybrid Electric Vehicles, Fuel Cell Electric Vehicles, and Plug-in Hybrid Electric Vehicles. BEVs are also known as All-Electric Vehicles (AEV). Electric Vehicles using BEV technology run entirely on a battery-powered electric drive train.
Insight by Vehicle Type
Based on vehicle type, the Global Electric Vehicle Aftermarket is bifurcated into Passenger Cars and Commercial Vehicles. Due to their versatility and widespread adoption, passenger cars dominate the market as this segment holds a unique place within the electric vehicle aftermarket. As passenger car manufacturers continue to introduce new models and technologies, the aftermarket adapts and evolves to provide compatible products and services, which enables longer ranges. Overall durability and cost-effectiveness of electric vehicles is maintained to a longer lifespan.
Insight by Certification Type
Based on certification type, the Electric Vehicle Aftermarket is further segmented into Genuine Parts, Certified Parts and Uncertified Parts. Genuine parts dominate the market, as this segment holds significant importance due to the critical role it plays in ensuring quality, compatibility, and performance. Electric vehicles often involve complex interactions between various components, such as battery management systems, regenerative braking systems, and electric drivetrains. Genuine parts are engineered to work in harmony with these intricate systems, reducing the risk of compatibility issues or malfunctions.
Insight by Distribution Channel
Based on distribution channels, the Electric Vehicle Aftermarket is classified into Authorized Service Centers (OEMs), Premium Multi-brand Service Centers, Digital Aggregators, and Others. Authorized service centers (OEMs) dominate this market as this segment offers a range of benefits that set them apart within the electric vehicle aftermarket.
The direct connection with the manufacturers helps maintain the integrity of the vehicles, ensuring that repairs and replacements are carried out with components that meet the manufacturer's rigorous quality standards. Furthermore, the expertise of technicians at authorized centers ensures that repairs are conducted with precision, reducing the risk of potential issues arising from improper servicing.
Global Electric Vehicle Aftermarket Report Coverage
|
Report Metric |
Details |
|
Historical Period |
2018 - 2023 |
|
Base Year Considered |
2024 |
|
Forecast Period |
2025 - 2030 |
|
Market Size in 2024 |
U.S.D. 0.06 Billion |
|
Revenue Forecast in 2030 |
U.S.D. 0.21 Billion |
|
Growth Rate |
19.87% |
|
Segments Covered in the Report |
By Replacement Part, By Propulsion Type, By Vehicle Type, By Certification and By Distribution channel |
|
Report Scope |
Market Trends, Drivers, and Restraints; Revenue Estimation and Forecast; Segmentation Analysis; Impact of COVID-19; Companies’ Strategic Developments; Market Share Analysis of Key Players; Company Profiling |
|
Regions Covered in the Report |
North America, Asia-Pacific, Europe, Latin America and Middle East and Africa |
Industry Dynamics
Growth Drivers
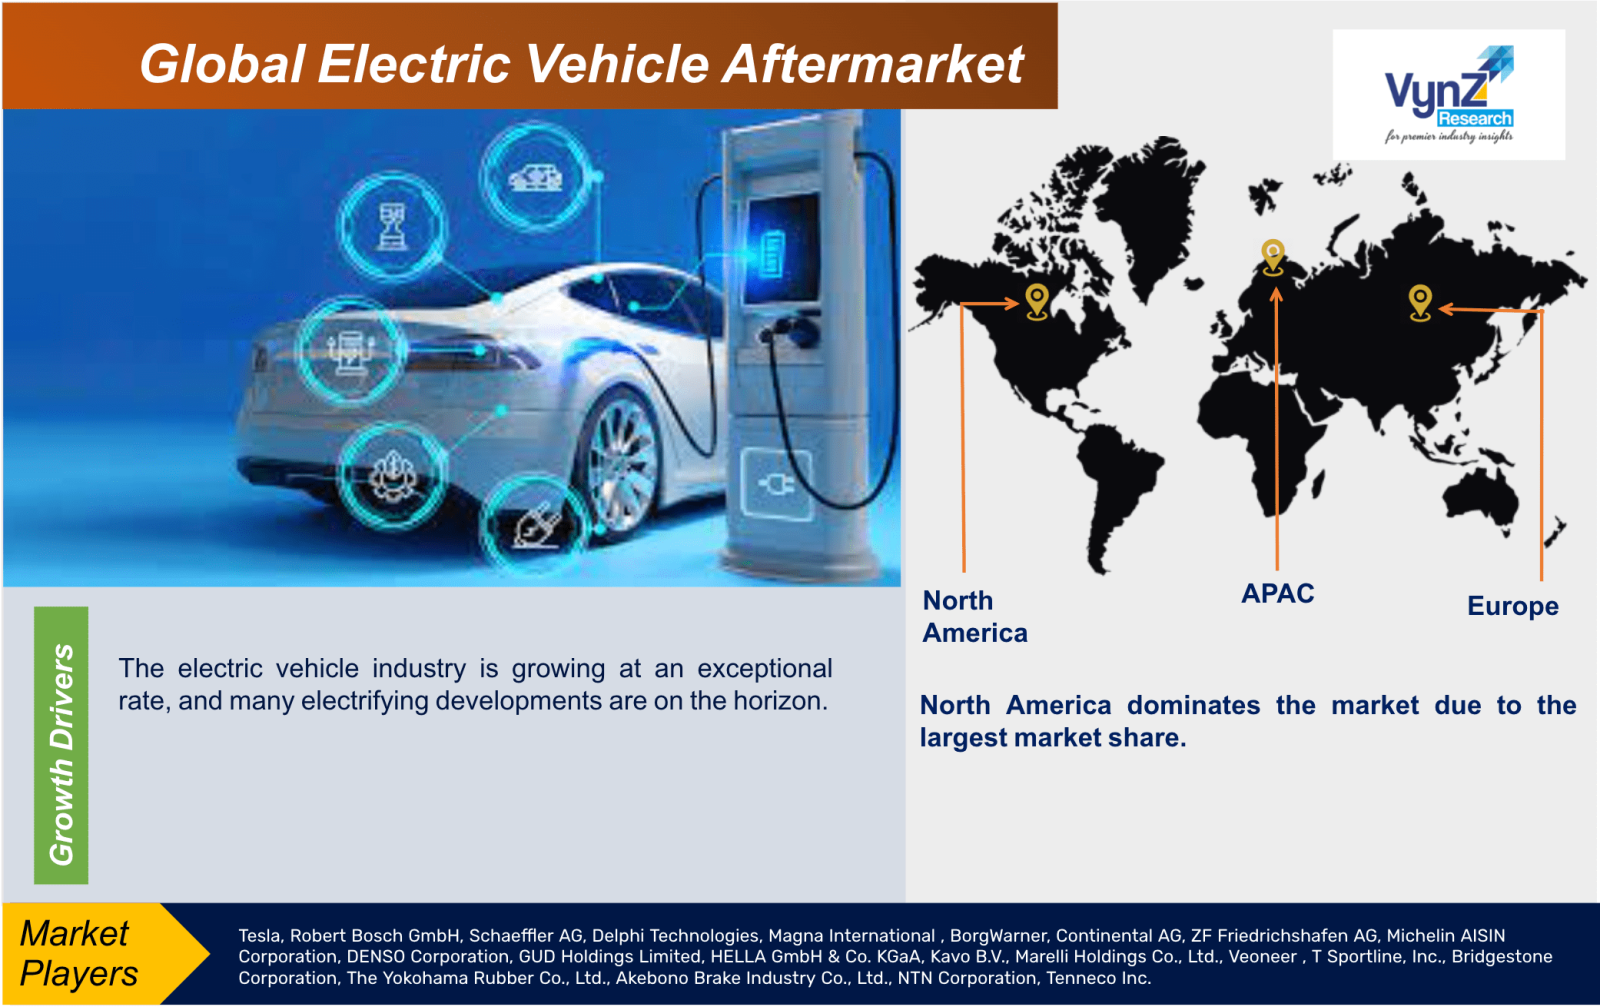
The electric vehicle industry is growing at an exceptional rate, and many electrifying developments are on the horizon. Despite supply constraints and the COVID-19 pandemic, the number of passenger EVs on the road is expected to grow gradually. The Global Electric Aftermarket is mainly driven by the price of EVs which is dropping as technology improves and manufacturing becomes more efficient. As the charging infrastructure improves, the anxiety of manufacturers of electric vehicles is slowly being alleviated. Government incentives are making EVs more attractive to consumers. EVs are becoming more popular as they are a cleaner and more sustainable option.
EV manufacturers are introducing new models and upgrades, hence aftermarket companies leverage these developments to create innovative products and services that enhance the overall EV ownership experience. This technological advancement allows for customization opportunities that cater to diverse consumer preferences. EV owners seek aftermarket solutions to modify their vehicle’s performance, battery capabilities, and charging options. Technological advancements foster a competitive landscape in which aftermarket providers continually strive to offer cutting-edge solutions, thus stimulating the growth of the electric vehicle aftermarket.
The need for convenient and accessible charging stations becomes dominant, as the adoption of EVs speed up. Various aftermarket companies grab this opportunity by offering innovative charging solutions that address various charging requirements. As more consumers switch to EVs, the demand for versatile and efficient charging solutions drives the electric vehicle aftermarket to develop novel products that ease charging concerns.
Restraints
Limited awareness and perception is the major restraint of the Electric Vehicle Aftermarket. Despite the popularity of electric vehicles, still there is a lack of awareness and understanding regarding the electric vehicles' aftermarket offerings. The products and services of Electric Vehicle Aftermarket can be relatively high compared to their local counterparts. The limited expertise and training available for servicing and repairing EVs is another constrain. EVs require specialized knowledge and skills to handle their unique components, such as high-voltage batteries and electric drivetrains, unlike conventional vehicles.
Geographic Overview
- North America
- Europe
- Asia Pacific (APAC)
- Latin America
- Middle East and Africa
Based on region, The Global Electric Vehicle Aftermarket is segmented into North America, Europe, Asia Pacific, Latin America, and Middle East and Africa.
North America dominates the market due to the largest market share. North America boasts a developed automotive infrastructure, including a well-established network of dealerships, service centers, and charging stations. This infrastructure provides a solid foundation for the electric vehicle aftermarket to flourish, offering a wide variety of solutions ranging from performance enhancements and battery upgrades to maintenance services and aesthetic modifications.
Furthermore, several major EV manufacturers and tech companies feel the region as its home that are at the forefront of innovation in the electric mobility sector. This awareness of industry leaders facilitates collaborations, and technical know-how leading to the development of cutting-edge aftermarket offerings that cater to the evolving needs of North American EV owners.
Key Players Covered in the Report
Some of the leading EV aftermarket companies include Tesla, Robert Bosch GmbH, Schaeffler AG, Delphi Technologies, Magna International, BorgWarner, Continental AG, ZF Friedrichshafen AG, Michelin AISIN Corporation, DENSO Corporation, GUD Holdings Limited, HELLA GmbH & Co. KGaA, Kavo B.V., Marelli Holdings Co., Ltd., Veoneer, T Sportline, Inc., Bridgestone Corporation, The Yokohama Rubber Co., Ltd., Akebono Brake Industry Co., Ltd., NTN Corporation, Tenneco Inc.
Recently, Veoneer’s Restraint Control Systems (RCS) business has been awarded a significant, long-term contract to deliver its market-leading next-generation product to one of North America’s largest OEMs. In 2026, Veneer will begin delivering the restraint control system to four of the North American OEM’s vehicle platforms, including its electric vehicles.
Robert Bosch, LLC announced it has added 133 automotive aftermarket parts to its portfolio in recent times, covering more than 34 million vehicles in operation across North America — reinforcing the company’s commitment to offering a complete range of high-quality and reliable parts for the whole workshop.
The availability of a robust charging infrastructure is one of the major roadblocks to wider EV adoption. There are three available charging levels: 1, 2 and 3. Each level differentiates charging based on voltage, which simply translates to the speed of energy delivery.
Tesla vehicles have notoriously stuck to a proprietary network of fast Level 3 and Level 2 chargers, but with adapters, non-Teslas can connect to Tesla chargers and vice versa. But that’s not without one major exception: Level 3 Tesla stations.
Tesla has a vast network of proprietary Level 3 high-speed chargers called “Superchargers.” The rest of the industry splits between two standards: Nissan and Mitsubishi use the Asian standard called CHAdeMO and all other manufacturers use the Combined Charging System, or “Combo” plug, to hook up to DC Fast Chargers. Currently, only CHAdeMO offers an adapter for Tesla vehicles to use DCFC..
The global electric vehicle aftermarket report offers a comprehensive market segmentation analysis along with an estimation for the forecast period 2025–2030.
Segments Covered in the Report
- By Replacement Part
- Tire
- Battery
- Brake parts
- Filters
- Body parts
- Lighting and electronic components
- Wheels
- Turbocharges
- Others
- By Propulsion Type
- Battery Electric Vehicles
- Hybrid Electric Vehicles
- Fuel Cell Electric Vehicles
- Plug-in Hybrid Electric Vehicles
- By Vehicle Type
- Passenger Cars
- Commercial vehicles
- By Certification Type
- Genuine parts
- Certified parts
- Uncertified parts
- By Distribution channel
- Authorized Service Centers (OEMs)
- Premium Multi-brand Service Centers
- Digital Aggregators
- Others
Region Covered in the Report
- North America
- U.S.
- Canada
- Mexico
- Europe
- Germany
- U.K.
- France
- Italy
- Spain
- Russia
- Rest of Europe
- Asia-Pacific (APAC)
- China
- Japan
- India
- South Korea
- Rest of Asia-Pacific
- Rest of the World (RoW)
- Brazil
- Saudi Arabia
- South Africa
- U.A.E.
- Other Countries
.png)
1. Research Overview
1.1. The Report Offers
1.2. Market Coverage
1.2.1. By Replacement Part
1.2.2. By Propulsion Type
1.2.3. By Vehicle Type
1.2.4. By Certification Type
1.2.5. By Distribution channel
1.2.6. By Region
1.3. Research Phases
1.4. Limitations
1.5. Market Methodology
1.5.1. Data Sources
1.5.1.1. Primary Research
1.5.1.2. Secondary Research
1.5.2. Methodology
1.5.2.1. Data Exploration
1.5.2.2. Forecast Parameters
1.5.2.3. Data Validation
1.5.2.4. Assumptions
1.5.3. Study Period & Data Reporting Unit
2. Executive Summary
3. Industry Overview
3.1. Industry Dynamics
3.1.1. Market Growth Drivers
3.1.2. Market Restraints
3.1.3. Key Market Trends
3.1.4. Major Opportunities
3.2. Industry Ecosystem
3.2.1. Porter’s Five Forces Analysis
3.2.2. Recent Development Analysis
3.2.3. Value Chain Analysis
3.3. Competitive Insight
3.3.1. Competitive Position of Industry Players
3.3.2. Market Attractive Analysis
3.3.3. Market Share Analysis
4. Global Market Estimate and Forecast
4.1. Global Market Overview
4.2. Global Market Estimate and Forecast to 2030
5. Market Segmentation Estimate and Forecast
5.1. By Replacement Part
5.1.1. Tire
5.1.1.1. Market Definition
5.1.1.2. Market Estimation and Forecast to 2030
5.1.2. Battery
5.1.2.1. Market Definition
5.1.2.2. Market Estimation and Forecast to 2030
5.1.3. Brake parts
5.1.3.1. Market Definition
5.1.3.2. Market Estimation and Forecast to 2030
5.1.4. Filters
5.1.4.1. Market Definition
5.1.4.2. Market Estimation and Forecast to 2030
5.1.5. Body parts
5.1.5.1. Market Definition
5.1.5.2. Market Estimation and Forecast to 2030
5.1.6. Lighting and electronic components
5.1.6.1. Market Definition
5.1.6.2. Market Estimation and Forecast to 2030
5.1.7. Wheels
5.1.7.1. Market Definition
5.1.7.2. Market Estimation and Forecast to 2030
5.1.8. Turbocharges
5.1.8.1. Market Definition
5.1.8.2. Market Estimation and Forecast to 2030
5.1.9. Others
5.1.9.1. Market Definition
5.1.9.2. Market Estimation and Forecast to 2030
5.2. By Propulsion Type
5.2.1. Battery Electric Vehicles
5.2.1.1. Market Definition
5.2.1.2. Market Estimation and Forecast to 2030
5.2.2. Hybrid Electric Vehicles
5.2.2.1. Market Definition
5.2.2.2. Market Estimation and Forecast to 2030
5.2.3. Fuel Cell Electric Vehicles
5.2.3.1. Market Definition
5.2.3.2. Market Estimation and Forecast to 2030
5.2.4. Plug-in Hybrid Electric Vehicles
5.2.4.1. Market Definition
5.2.4.2. Market Estimation and Forecast to 2030
5.3 By Vehicle Type
5.3.1. Passenger Cars
5.3.1.1. Market Definition
5.3.1.2. Market Estimation and Forecast to 2030
5.3.2. Commercial vehicles
5.3.2.1. Market Definition
5.3.2.2. Market Estimation and Forecast to 2030
5.4. By Certification Type
5.4.1. Genuine parts
5.2.1.1. Market Definition
5.2.1.2. Market Estimation and Forecast to 2030
5.4.2. Certified parts
5.2.2.1. Market Definition
5.2.2.2. Market Estimation and Forecast to 2030
5.4.3. Uncertified parts
5.2.3.1. Market Definition
5.2.3.2. Market Estimation and Forecast to 2030
5.5. By Distribution channel
5.5.1. Authorized Service Centers (OEMs)
5.2.1.1. Market Definition
5.2.1.2. Market Estimation and Forecast to 2030
5.5.2. Premium Multi-brand Service Centers
5.2.2.1. Market Definition
5.2.2.2. Market Estimation and Forecast to 2030
5.5.3. Digital Aggregators
5.2.3.1. Market Definition
5.2.3.2. Market Estimation and Forecast to 2030
5.5.4. Others
5.2.3.1. Market Definition
5.2.3.2. Market Estimation and Forecast to 2030
6. North America Market Estimate and Forecast
6.1. By Replacement Part
6.2. By Propulsion Type
6.3. By Vehicle Type
6.4. By Certification Type
6.5. By Distribution channel
6.5.1. U.S. Market Estimate and Forecast
6.5.2. Canada Market Estimate and Forecast
6.5.3. Mexico Market Estimate and Forecast
7. Europe Market Estimate and Forecast
7.1. By Replacement Part
7.2. By Propulsion Type
7.3. By Vehicle Type
7.4. By Certification Type
7.5. By Distribution channel
7.4.1. Germany Market Estimate and Forecast
7.4.2. France Market Estimate and Forecast
7.4.3. U.K. Market Estimate and Forecast
7.4.4. Italy Market Estimate and Forecast
7.4.5. Spain Market Estimate and Forecast
7.4.6. Rest of Europe Market Estimate and Forecast
8. Asia-Pacific Market Estimate and Forecast
8.1. By Replacement Part
8.2. By Propulsion Type
8.3. By Vehicle Type
8.4. By Certification Type
8.5. By Distribution channel
8.4. By Country – China, Japan, India, South Korea, and Rest of Asia-Pacific
8.4.1. China Market Estimate and Forecast
8.4.2. Japan Market Estimate and Forecast
8.4.3. India Market Estimate and Forecast
8.4.4. South Korea Market Estimate and Forecast
8.4.5. Singapore Market Estimate and Forecast
8.4.6. Rest of Asia-Pacific Market Estimate and Forecast
9. Rest of the World (RoW) Market Estimate and Forecast
9.1. By Replacement Part
9.2. By Propulsion Type
9.3. By Vehicle Type
9.4. By Certification Type
9.5. By Distribution channel
9.4. By Country – Brazil, Saudi Arabia, South Africa, U.A.E., and Other Countries
9.4.1. Brazil Market Estimate and Forecast
9.4.2. Saudi Arabia Market Estimate and Forecast
9.4.3. South Africa Market Estimate and Forecast
9.4.4. Other Countries Market Estimate and Forecast
10. Company Profiles
10.1. Tesla
10.1.1. Snapshot
10.1.2. Overview
10.1.3. Offerings
10.1.4. Financial Insight
10.1.5. Recent Developments
10.2. Robert Bosch GmbH
10.2.1. Snapshot
10.2.2. Overview
10.2.3. Offerings
10.2.4. Financial Insight
10.2.5. Recent Developments
10.3. Schaeffler AG
10.3.1. Snapshot
10.3.2. Overview
10.3.3. Offerings
10.3.4. Financial Insight
10.3.5. Recent Developments
10.4. Delphi Technologies
10.4.1. Snapshot
10.4.2. Overview
10.4.3. Offerings
10.4.4. Financial Insight
10.4.5. Recent Developments
10.5. Magna International
10.5.1. Snapshot
10.5.2. Overview
10.5.3. Offerings
10.5.4. Financial Insight
10.5.5. Recent Developments
10.6. BorgWarner
10.6.1. Snapshot
10.6.2. Overview
10.6.3. Offerings
10.6.4. Financial Insight
10.6.5. Recent Developments
10.7. Continental AG
10.7.1. Snapshot
10.7.2. Overview
10.7.3. Offerings
10.7.4. Financial Insight
10.7.5. Recent Developments
10.8. ZF Friedrichshafen AG
10.8.1. Snapshot
10.8.2. Overview
10.8.3. Offerings
10.8.4. Financial Insight
10.8.5. Recent Developments
10.9. Michelin AISIN Corporation
10.9.1. Snapshot
10.9.2. Overview
10.9.3. Offerings
10.9.4. Financial Insight
10.9.5. Recent Developments
10.10. DENSO Corporation
10.10.1. Snapshot
10.10.2. Overview
10.10.3. Offerings
10.10.4. Financial Insight
10.11. GUD Holdings Limited
10.11.1. Snapshot
10.11.2. Overview
10.11.3. Offerings
10.11.4. Financial Insight
10.12. HELLA GmbH & Co. KGaA
10.12.1. Snapshot
10.12.2. Overview
10.12.3. Offerings
10.12.4. Financial Insight
10.13. Kavo B.V.
10.13.1. Snapshot
10.13.2. Overview
10.13.3. Offerings
10.13.4. Financial Insight
10.14. Marelli Holdings Co., Ltd.
10.14.1. Snapshot
10.14.2. Overview
10.14.3. Offerings
10.14.4. Financial Insight
10.15. Veoneer
10.15.1. Snapshot
10.15.2. Overview
10.15.3. Offerings
10.15.4. Financial Insight
10.16. T Sportline, Inc.
10.16.1. Snapshot
10.16.2. Overview
10.16.3. Offerings
10.16.4. Financial Insight
10.17. Bridgestone Corporation
10.17.1. Snapshot
10.17.2. Overview
10.17.3. Offerings
10.17.4. Financial Insight
10.18. The Yokohama Rubber Co., Ltd.
10.18.1. Snapshot
10.18.2. Overview
10.18.3. Offerings
10.18.4. Financial Insight
10.19. Akebono Brake Industry Co., Ltd.
10.19.1. Snapshot
10.19.2. Overview
10.19.3. Offerings
10.19.4. Financial Insight
10.20. NTN Corporation
10.20.1. Snapshot
10.20.2. Overview
10.20.3. Offerings
10.20.4. Financial Insight
10.21. Tenneco Inc.
10.21.1. Snapshot
10.21.2. Overview
10.21.3. Offerings
10.21.4. Financial Insight
11. Appendix
11.1. Exchange Rates
11.2. Abbreviations
Note: Financial insight and recent developments of different companies are subject to the availability of information in the secondary domain.
List of Tables
Table 1 Applications
Table 2 Study Periods
Table 3 Data Reporting Unit
Table 4 Global Electric Vehicle Aftermarket Size, By Replacement Part, 2018 – 2023 (USD Billion)
Table 5 Global Electric Vehicle Aftermarket Size, By Replacement Part, 2025 – 2030 (USD Billion)
Table 6 Global Electric Vehicle Aftermarket Size, By Propulsion Type, 2018 – 2023 (USD Billion)
Table 7 Global Electric Vehicle Aftermarket Size, By Propulsion Type, 2025 – 2030 (USD Billion)
Table 8 Global Electric Vehicle Aftermarket Size, By Vehicle Type, 2018 – 2023 (USD Billion)
Table 9 Global Electric Vehicle Aftermarket Size, By Vehicle Type, 2025 – 2030 (USD Billion)
Table 10 Global Electric Vehicle Aftermarket Size, By Certification Type, 2018 – 2023 (USD Billion)
Table 11 Global Electric Vehicle Aftermarket Size, By Certification Type, 2025 – 2030 (USD Billion)
Table 12 Global Electric Vehicle Aftermarket Size, By Distribution channel, 2018 – 2023 (USD Billion)
Table 13 Global Electric Vehicle Aftermarket Size, By Distribution channel, 2025 – 2030 (USD Billion)
Table 14 Global Electric Vehicle Aftermarket Size, by Region, 2018 – 2023 (USD Billion)
Table 15 Global Electric Vehicle Aftermarket Size, by Region, 2025 – 2030 (USD Billion)
Table 16 North America Electric Vehicle Aftermarket Size, By Replacement Part, 2018 – 2023 (USD Billion)
Table 17 North America Electric Vehicle Aftermarket Size, By Replacement Part, 2025 – 2030 (USD Billion)
Table 18 North America Electric Vehicle Aftermarket Size, By Propulsion Type, 2018 – 2023 (USD Billion)
Table 19 North America Electric Vehicle Aftermarket Size, By Propulsion Type, 2025 – 2030 (USD Billion)
Table 20 North America Electric Vehicle Aftermarket Size, By Vehicle Type, 2018 – 2023 (USD Billion)
Table 21 North America Electric Vehicle Aftermarket Size, By Vehicle Type, 2025 – 2030 (USD Billion)
Table 22 Global Electric Vehicle Aftermarket Size, By Certification Type, 2018 – 2023 (USD Billion)
Table 23 Global Electric Vehicle Aftermarket Size, By Certification Type, 2025 – 2030 (USD Billion)
Table 24 Global Electric Vehicle Aftermarket Size, By Distribution channel, 2018 – 2023 (USD Billion)
Table 25 Global Electric Vehicle Aftermarket Size, By Distribution channel, 2025 – 2030 (USD Billion)
Table 26 North America Electric Vehicle Aftermarket Size, by Country, 2018 – 2023 (USD Billion)
Table 27 North America Electric Vehicle Aftermarket Size, by Country, 2025 – 2030 (USD Billion)
Table 28 Europe Electric Vehicle Aftermarket Size, By Replacement Part, 2018 – 2023 (USD Billion)
Table 29 Europe Electric Vehicle Aftermarket Size, By Replacement Part, 2025 – 2030 (USD Billion)
Table 30 Europe Electric Vehicle Aftermarket Size, By Propulsion Type, 2018 – 2023 (USD Billion)
Table 31 Europe Electric Vehicle Aftermarket Size, By Propulsion Type, 2025 – 2030 (USD Billion)
Table 32 Europe Electric Vehicle Aftermarket Size, By Vehicle Type, 2018 – 2023 (USD Billion)
Table 33 Europe Electric Vehicle Aftermarket Size, By Vehicle Type, 2025 – 2030 (USD Billion)
Table 34 Global Electric Vehicle Aftermarket Size, By Certification Type, 2018 – 2023 (USD Billion)
Table 35 Global Electric Vehicle Aftermarket Size, By Certification Type, 2025 – 2030 (USD Billion)
Table 36 Global Electric Vehicle Aftermarket Size, By Distribution channel, 2018 – 2023 (USD Billion)
Table 37 Global Electric Vehicle Aftermarket Size, By Distribution channel, 2025 – 2030 (USD Billion)
Table 38 Europe Electric Vehicle Aftermarket Size, by Country, 2018 – 2023 (USD Billion)
Table 39 Europe Electric Vehicle Aftermarket Size, by Country, 2025 – 2030 (USD Billion)
Table 40 Asia-Pacific Electric Vehicle Aftermarket Size, By Replacement Part, 2018 – 2023 (USD Billion)
Table 41 Asia-Pacific Electric Vehicle Aftermarket Size, By Replacement Part, 2025 – 2030 (USD Billion)
Table 42 Asia-Pacific Electric Vehicle Aftermarket Size, By Propulsion Type, 2018 – 2023 (USD Billion)
Table 43 Asia-Pacific Electric Vehicle Aftermarket Size, By Propulsion Type, 2025 – 2030 (USD Billion)
Table 44 Asia-Pacific Electric Vehicle Aftermarket Size, By Vehicle Type, 2018 – 2023 (USD Billion)
Table 45 Asia-Pacific Electric Vehicle Aftermarket Size, By Vehicle Type, 2025 – 2030 (USD Billion)
Table 46 Global Electric Vehicle Aftermarket Size, By Certification Type, 2018 – 2023 (USD Billion)
Table 47 Global Electric Vehicle Aftermarket Size, By Certification Type, 2025 – 2030 (USD Billion)
Table 48 Global Electric Vehicle Aftermarket Size, By Distribution channel, 2018 – 2023 (USD Billion)
Table 49 Global Electric Vehicle Aftermarket Size, By Distribution channel, 2025 – 2030 (USD Billion)
Table 50 Asia-Pacific Electric Vehicle Aftermarket Size, by Country, 2018 – 2023 (USD Billion)
Table 51 Asia-Pacific Electric Vehicle Aftermarket Size, by Country, 2025 – 2030 (USD Billion)
Table 52 RoW Electric Vehicle Aftermarket Size, By Replacement Part, 2018 – 2023 (USD Billion)
Table 53 RoW Electric Vehicle Aftermarket Size, By Replacement Part, 2025 – 2030 (USD Billion)
Table 54 RoW Electric Vehicle Aftermarket Size, By Propulsion Type, 2018 – 2023 (USD Billion)
Table 55 RoW Electric Vehicle Aftermarket Size, By Propulsion Type, 2025 – 2030 (USD Billion)
Table 56 RoW Electric Vehicle Aftermarket Size, By Vehicle Type, 2018 – 2023 (USD Billion)
Table 57 RoW Electric Vehicle Aftermarket Size, By Vehicle Type, 2025 – 2030 (USD Billion)
Table 58 Global Electric Vehicle Aftermarket Size, By Certification Type, 2018 – 2023 (USD Billion)
Table 59 Global Electric Vehicle Aftermarket Size, By Certification Type, 2025 – 2030 (USD Billion)
Table 60 Global Electric Vehicle Aftermarket Size, By Distribution channel, 2018 – 2023 (USD Billion)
Table 61 Global Electric Vehicle Aftermarket Size, By Distribution channel, 2025 – 2030 (USD Billion)
Table 62 RoW Electric Vehicle Aftermarket Size, by Country, 2018 – 2023 (USD Billion)
Table 63 RoW Electric Vehicle Aftermarket Size, by Country, 2025 – 2030 (USD Billion)
Table 64 Snapshot – Tesla
Table 65 Snapshot – Robert Bosch GmbH
Table 66 Snapshot – Schaeffler AG
Table 67 Snapshot – Delphi Technologies
Table 68 Snapshot – Magna International
Table 69 Snapshot – BorgWarner
Table 70 Snapshot – Continental AG
Table 71 Snapshot – ZF Friedrichshafen AG
Table 72 Snapshot – Michelin AISIN Corporation
Table 73 Snapshot – DENSO Corporation
Table 74 Snapshot – GUD Holdings Limited
Table 75 Snapshot – HELLA GmbH & Co. KGaA
Table 76 Snapshot – Kavo B.V.
Table 77 Snapshot – Marelli Holdings Co., Ltd.
Table 78 Snapshot – Veoneer
Table 79 Snapshot – T Sportline, Inc.
Table 80 Snapshot – Bridgestone Corporation
Table 81 Snapshot – The Yokohama Rubber Co., Ltd.
Table 82 Snapshot – Akebono Brake Industry Co., Ltd.
Table 83 Snapshot – NTN Corporation
Table 84 Snapshot – Tenneco Inc.
List of Figures
Figure 1 Market Coverage
Figure 2 Research Phases
Figure 3 Secondary Product Types for Different Parameters
Figure 4 Methodology
Figure 5 Data Mining & Exploration
Figure 6 Data Triangulation
Figure 7 Assumptions for Market Estimation and Forecast
Figure 8 Market Synopsis
Figure 9 Global Electric Vehicle Aftermarket - Growth Drivers and Restraints
Figure 10 Competitive Benchmark
Figure 11 Global Electric Vehicle Aftermarket Highlight
Figure 12 Global Electric Vehicle Aftermarket Size, By Replacement Part, 2018 - 2030 (USD Billion)
Figure 13 Global Electric Vehicle Aftermarket Size, By Propulsion Type 2018 - 2030 (USD Billion)
Figure 14 Global Electric Vehicle Aftermarket Size, By Vehicle Type 2018 - 2030 (USD Billion)
Figure 15 Global Electric Vehicle Aftermarket Size, By Certification Type 2018 - 2030 (USD Billion)
Figure 16 Global Electric Vehicle Aftermarket Size, By Distribution channel 2018 - 2030 (USD Billion)
Figure 17 Global Electric Vehicle Aftermarket Size, by Region, 2018 - 2030 (USD Billion)
Figure 18 North America Electric Vehicle Aftermarket Highlight
Figure 19 North America Electric Vehicle Aftermarket Size, By Replacement Part, 2018 - 2030 (USD Billion)
Figure 20 North America Electric Vehicle Aftermarket Size, By Propulsion Type 2018 - 2030 (USD Billion)
Figure 21 North America Electric Vehicle Aftermarket Size, By Vehicle Type 2018 - 2030 (USD Billion)
Figure 22 Global Electric Vehicle Aftermarket Size, By Certification Type 2018 - 2030 (USD Billion)
Figure 23 Global Electric Vehicle Aftermarket Size, By Distribution channel 2018 - 2030 (USD Billion)
Figure 24 North America Electric Vehicle Aftermarket Size, by Country, 2018 - 2030 (USD Billion)
Figure 25 Europe Electric Vehicle Aftermarket Highlight
Figure 26 Europe Electric Vehicle Aftermarket Size, By Replacement Part, 2018 - 2030 (USD Billion)
Figure 27 Europe Electric Vehicle Aftermarket Size, By Propulsion Type 2018 - 2030 (USD Billion)
Figure 28 Europe Electric Vehicle Aftermarket Size, By Vehicle Type 2018 - 2030 (USD Billion)
Figure 29 Global Electric Vehicle Aftermarket Size, By Certification Type 2018 - 2030 (USD Billion)
Figure 30 Global Electric Vehicle Aftermarket Size, By Distribution channel 2018 - 2030 (USD Billion)
Figure 31 Europe Electric Vehicle Aftermarket Size, by Country, 2018 - 2030 (USD Billion)
Figure 32 Asia-Pacific Electric Vehicle Aftermarket Highlight
Figure 33 Asia-Pacific Electric Vehicle Aftermarket Size, By Replacement Part, 2018 - 2030 (USD Billion)
Figure 34 Asia-Pacific Electric Vehicle Aftermarket Size, By Propulsion Type 2018 - 2030 (USD Billion)
Figure 35 Asia-Pacific Electric Vehicle Aftermarket Size, By Vehicle Type 2018 - 2030 (USD Billion)
Figure 36 Global Electric Vehicle Aftermarket Size, By Certification Type 2018 - 2030 (USD Billion)
Figure 37 Global Electric Vehicle Aftermarket Size, By Distribution channel 2018 - 2030 (USD Billion)
Figure 38 Asia-Pacific Electric Vehicle Aftermarket Size, by Country, 2018 - 2030 (USD Billion)
Figure 39 RoW Electric Vehicle Aftermarket Highlight
Figure 40 RoW Electric Vehicle Aftermarket Size, By Replacement Part, 2018 - 2030 (USD Billion)
Figure 41 RoW Electric Vehicle Aftermarket Size, By Propulsion Type 2018 - 2030 (USD Billion)
Figure 42 RoW Electric Vehicle Aftermarket Size, By Vehicle Type 2018 - 2030 (USD Billion)
Figure 43 Global Electric Vehicle Aftermarket Size, By Certification Type 2018 - 2030 (USD Billion)
Figure 44 Global Electric Vehicle Aftermarket Size, By Distribution channel 2018 - 2030 (USD Billion)
Figure 45 RoW Electric Vehicle Aftermarket Size, by Country, 2018 - 2030 (USD Billion)
Global Electric Vehicle Aftermarket Coverage
Replacement Part Insight and Forecast 2025-2030
- Tire
- Battery
- Brake parts
- Filters
- Body parts
- Lighting and electronic components
- Wheels
- Turbocharges
- Others
Propulsion Type Insight and Forecast 2025-2030
- Battery Electric Vehicles
- Hybrid Electric Vehicles
- Fuel Cell Electric Vehicles
- Plug-in Hybrid Electric Vehicles
Vehicle Type Insight and Forecast 2025-2030
- Passenger Cars
- Commercial vehicles
Certification Type Insight and Forecast 2025-2030
- Genuine parts
- Certified parts
- Uncertified parts
Distribution channel Insight and Forecast 2025-2030
- Authorized Service Centers (OEMs)
- Premium Multi-brand Service Centers
- Digital Aggregators
- Others
Geographical Segmentation
Anti-Aging Market by Region
- North America
- By Technology
- By Platform Type
- By Application
- By End-Use
- By Country – U.S., Canada, and Mexico
- Europe
- By Technology
- By Platform Type
- By Application
- By End-Use
- By Country – Germany, U.K., France, Italy, Spain, Russia, and Rest of Europe
- Asia-Pacific (APAC)
- By Technology
- By Platform Type
- By Application
- By End-Use
- By Country – China, Japan, India, South Korea, and Rest of Asia-Pacific
- Rest of the World (RoW)
- By Technology
- By Platform Type
- By Application
- By End-Use
- By Country – Brazil, Saudi Arabia, South Africa, U.A.E., and Other Countries
Vynz Research know in your business needs, you required specific answers pertaining to the market, Hence, our experts and analyst can provide you the customized research support on your specific needs.
After the purchase of current report, you can claim certain degree of free customization within the scope of the research.
Please let us know, how we can serve you better with your specific requirements to your research needs. Vynz research promises for quick reversal for your current business requirements.
- Tesla
- Robert Bosch GmbH
- Schaeffler AG
- Delphi Technologies
- Magna International
- BorgWarner
- Continental AG
- ZF Friedrichshafen AG
- Michelin AISIN Corporation
- DENSO Corporation
- GUD Holdings Limited
- HELLA GmbH & Co. KGaA
- Kavo B.V.
- Marelli Holdings Co. Ltd.
- Veoneer
- T Sportline Inc.
- Bridgestone Corporation
- The Yokohama Rubber Co. Ltd.
- Akebono Brake Industry Co. Ltd.
- NTN Corporation
- Tenneco Inc.
Purchase Options
Latest Report
Research Methodology
- Desk Research / Pilot Interviews
- Build Market Size Model
- Research and Analysis
- Final Deliverabvle
Connect With Our Sales Team
- Toll-Free: 1 888 253 3960
- Phone: +91 9960 288 381
- Email: enquiry@vynzresearch.com