- 1-888-253-3960
- enquiry@vynzresearch.com
-
This is lorem ipsum doller
Biostimulants Market
| Status : Published | Published On : May, 2024 | Report Code : VRFB11017 | Industry : Chemicals & Materials | Available Format :

|
Page : 200 |

Global Biostimulants Market – Analysis and Forecast (2025-2030)
Industry Insight by Active Ingredients (Acid-Based (Humic Acid, Amino Acid, and Fulvic Acid), Extract-Based (Seaweed Extracts and Other Botanical Extracts), Microbial Amendments, Trace Minerals and Vitamins, and Others), by Crop Type (Cereals & Grains, Oilseeds & Pulses, Fruits & Vegetables, Turfs & Ornamentals, and Others), by Formulation (Liquid Formulation (Suspension Concentrates, Soluble Liquid Concentrates, and Emulsifiable Concentrates) and Dry Formulation (Dry Granules, Wettable Powder, and Water Dispersible)), and Geography (U.S., Canada, Germany, U.K., France, China, Japan, India, and Rest of the World)
Industry Overview
The global biostimulants market size was valued at USD 2.9 billion in 2023 and is anticipated to reach USD 5.9 billion by 2030, witnessing a CAGR of 12.3% during the forecast period.
Biostimulants refer to the naturally derived additives or the microorganisms and used in crops to increase production and cultivation. These additives help enhance the nutritional value and efficiency as well as the quality of the crop. It also helps in maintaining soil quality. Biostimulants are also used to enhance the stress tolerance level of plants and crops at the times of drought especially. All these benefits help the global food and agricultural production systems to overcome the challenge of meeting the increase in demand for food due to the growing population, malnutrition, and huger worldwide, as well as soil degradation, climate change, overutilization of natural resources, loss of food, loss of biodiversity, and wastage.
The market is segregated by active ingredients like acid-based segment which dominates the market, and by crop type such as fruits & vegetables which will grow due to higher demand. It is also divided by formulation for the biostimulants where liquid formulation segment will grow more than the dry formulation. Microbial and non-microbial are the two segments in which the biostimulant market is divided based on the source, where the latter will grow more than the former segment. Biostimulants have varied application which segregates the market as well where foliar application will grow faster due to higher efficiency and benefits offered.
Biostimulants Market Segmentation
Insight by Active Ingredients
The active ingredients used in making the biostimulants divided the global market into acid-based, extract-based, trace minerals and vitamins, and other segments. Out of these, the acid-based segment is further divided into humic acid, amino acid, and fulvic acid. The extract-based segment is further divided into seaweed extracts and other botanical extracts.
Out of all these divisions and subdivisions, the acid-based biostimulants segment dominates the market because it stimulates fruit setting, flowering, pollination, and fruit development of plants. In addition to offering such benefits, these are also easily available and helps increase productivity. These factors are expected to result in further growth of this segment in the forecast period.
The seaweed extracts segment is expected to have a higher rate of growth in the projected period because they are used extensively for plant growth as substances like cytokinins, auxins, and gibberellins carbohydrates, and several other nutritive metal elements such as iron, aluminum, nitrogen, manganese, and potassium enhance its effectiveness.
The most commonly used seaweed extracts are brown, green, and red algae. Out of these the brown seaweed extract like Sargassum, Laminaria, and Fucus offers higher benefits like higher yield, high nutrient uptake, faster germination of seed, flower, and fruit set, and also increases fruit quality.
Insight by Crop Type
The global biostimulants market can also be divided according to the crop type into cereals & grains, oilseeds & pulses, fruits & vegetables, turfs & ornamentals, and other segments.
Out of these segments, the fruits & vegetables segment dominates the market because it is widely used on crops to improve quality and standards to facilitate exports. There is also a growing demand for fruits & vegetables over the past few years due to the rising consciousness among people regarding their health and demand for safe and nutritious products, which further propels the growth of this specific segment during the projected period.
The cereals & grains segment is however expected to grow at a faster rate during the forecast period due to higher adoption and need to improve the nutrients content, tolerance to abiotic stress, and enhanced yield of crops like wheat, rice, and barley. In short, the all-round increase in acceptance of organic and sustainable farming will create better opportunities for growth in the global biostimulants market.
Insight by Formulation
Considering the formulation, the global biostimulants market is split into liquid formulation and dry formulation. The liquid formulation is further divided into suspension concentrates, soluble liquid concentrates, and emulsifiable concentrates. The dry formulation, on the other hand, is further divided into dry granules, wettable powder, and water dispersible.
Out of these two segments, the liquid formulation segment dominates the biostimulants market because these are easily transported and applied on crops. Moreover, being liquid, it helps in faster absorption of nutrients by the plants and leaves. This results in higher nutrient uptake and improved cellular activity.
Insight by Source
Depending on the source of the biostimulants, the market is divided into microbial and non-microbial segments. Out of these two segments, the non-microbial segment is expected to grow significantly during the forecast period as it helps in improving the physiological and biochemical traits of the crops. It also helps in plant growth without causing any harm to human health or to the environment.
On the other hand, the microbial section is also expected to grow at a higher rate during the forecast period due to the lack of high-quality agricultural land. These products will ensure higher plant growth and yield even in low-input conditions. It can also mitigate the effects of climate changes on crops due to the symbiotic relationship between the crops and bacteria or fungi. Th growth of this specific segment is also attributed to the role of the major players in the industry trying to introduce newer and better products in order to meet the growing demand.
Insight by Application
The global biostimulants market can be divided into soil treatment, foliar application, and seed treatment based on application.
Out of these three segments, the foliar application segment is expected to grow at a faster rate and contribute to the major share of the market during the projected period due to its higher effectiveness and ability to improve the health of plants in spite of stressful conditions. This helps in improving photosynthetic efficiency, antioxidant defense mechanism, water uptake, and photosynthetic pigment content in plants.
On the other hand, the seed treatment segment is also gaining popularity and is expected to grow in the forecast period. This is mainly attributed to the improved seed enhancement techniques which helps in augmenting seed germination and growth of the seedlings even when these are exposed to stressful environmental conditions. However, the soil treated products are likely to heighten the diversity in the microbial population in the soil. This will help in the growth of plant in all stages.
Global Biostimulants Market Report Coverage
|
Report Metric |
Details |
|
Historical Period |
2018 - 2023 |
|
Base Year Considered |
2024 |
|
Forecast Period |
2025 - 2030 |
|
Market Size in 2024 |
U.S.D. 2.9 Billion |
|
Revenue Forecast in 2030 |
U.S.D. 5.9 Billion |
|
Growth Rate |
12.3% |
|
Segments Covered in the Report |
By Active Ingredients, By Crop Type, and By Formulation |
|
Report Scope |
Market Trends, Drivers, and Restraints; Revenue Estimation and Forecast; Segmentation Analysis; Impact of COVID-19; Companies’ Strategic Developments; Market Share Analysis of Key Players; Company Profiling |
|
Regions Covered in the Report |
North America, Europe, Asia-Pacific, Middle East, and Rest of the World |
Industry Dynamics
Biostimulants Industry Trends
There is a growing demand for organic food products and clean label food in developed countries. In addition, there is also an increase in demand for sustainability in crop production and agriculture practices. These are the two major trends prevailing in the global biostimulants market.
Over the years, the growing demand for sustainably produced food has higher concentration of biologicals and lower concentration of synthetic chemicals. This have raised the use of biostimulants and the growth of the market worldwide.
Biostimulants Market Growth Drivers
The most significant factor that drives the growth of the global biostimulants market is the increase in crop quality and yield.
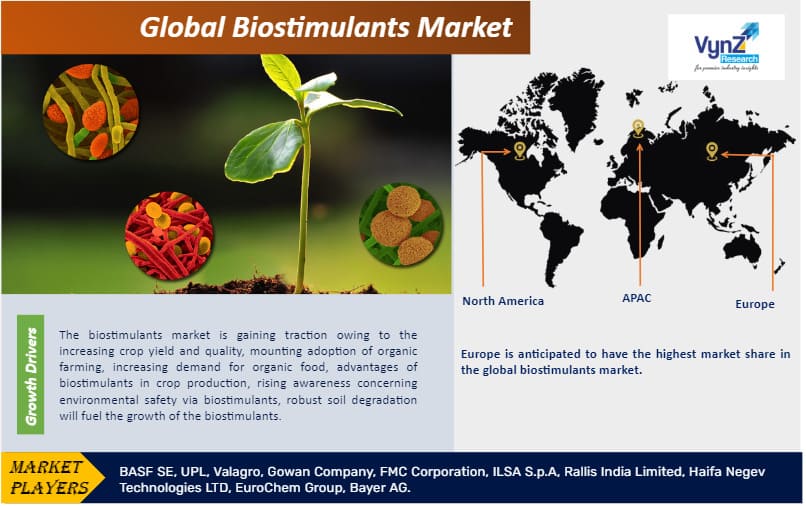
Also, there is a wider adoption of organic farming all over the world due to robust soil degradation which is driving the growth of this market along with the increase in demand for organic food.
In addition, there is a lot of advantages offered by the biostimulants used in crop production which also facilitates the sales, usage, and growth of the market.
The growing awareness about environmental safety and the fact that biostimulants can ensure that also results in the growth of the market.
Apart from that, biostimulants are non-toxic and therefore have as very low ecological footprint. These are therefore considered to be an effective and appropriate alternative to chemical-based agro products. The higher efficiency in performance has facilitated the replacement of harmful chemicals with this environmentally friendly substitute which is driving its market growth at a high rate.
Furthermore, the growing need to protect crops from abiotic stress due to climatic changes, rapid advancement in technology, research and development initiatives by the major players, and lack of arable land propels the growth of the global biostimulants market.
Biostimulants Market Challenges
The high cost involved in research and development, scientific and technical difficulties in development, high demand for synthetic fertilizers, commercialization of low-quality biostimulant products and the lack of regulations thereof, limited awareness about the availability of quality products in emerging economies, and underdeveloped regulatory framework in developing countries will hinder the growth of the global biostimulants market.
Biostimulants Market Opportunities
The growing awareness among people about the side effects of synthetic fertilizers has increased the demand for eco-friendly biostimulants. Also, the rise in government initiatives to promote the use of biostimulants in crop production are creative better and more lucrative growth opportunities of the global biostimulants market.
Biostimulants Market Geographic Overview
Europe will contribute to the larger share of the global biostimulants market. This is because there is a greater focus on sustainable agricultural practices in this region. It is also attributed to the continual development of innovative products. Typically, Italy, Spain, and France are the major exporters of biostimulants and drivers of the market growth on a global scale. Moreover, the government is also very supportive and takes specific initiatives to create favorable regulations to augment the production of organic foods. This helps the biostimulant market to grow substantially in the region.
On the other hand, the Asia-Pacific region is expected to witness a higher rate of growth during the forecast period. This is mainly because there are several agriculture-driven economies in this region, such as India, China, and others. The ever-rising population of this region as well as the economy is highly dependent on the agricultural sector, which provides greater and better opportunities for market growth in this region.
Biostimulants Market Competitive Insight
The industry players are adopting strategies such as product innovation, acquisitions, technology development, product expansion, and research & development activities to sustain in the market. Moreover, there are limited barriers to entry that allow new players to enter the market and enhance their geographical reach. The companies are integrating forward and backward to enhance their profit margins and gain high bargaining power.
UPL AgroSolutions Canada has received registration from the Canadian Food Inspection Agency for its first biosolutions product i.e., OHM Biostimulant. OHM is a highly concentrated liquid form of Ascophyllum nodosum seaweed extract that enhances the efficiency of nutrient use to improve plant growth and development.
Valagro manufactures a unique biostimulant line that provides farmers with a product line containing purely naturally derived active ingredients that stimulate the plant's major physiological processes while promoting plant growth and productivity.
FMC Corporation is an agricultural science company that offers innovative solutions to farmers around the world with a rapid product portfolio that leverages market-driven R&D in crop protection, plant health, professional pest, and turf management. FMC product Accudo biostimulant, a microbial innovation will lead to a yield increase of over 15%. It improves root development and has antifungal resistance, resulting in significantly higher yields compared to competing products.
FMC India, a pioneer in agricultural sciences, launched ENTAZIATM biofungicide, a novel biological crop protection product created with Bacillus subtilis, in August 2023. This cutting-edge technology provides farmers with a potent and sustainable tool for fungus protection while protecting environmental purity.
ENTAZIATM fungicide can be used in conjunction with FMC's biostimulants and synthetic fungicides in an integrated pest control program to provide additional plant advantages.
Some of the key players operating in the biostimulants market: are BASF SE, UPL, Valagro, Gowan Company, FMC Corporation, ILSA S.p.A, Rallis India Limited, Haifa Negev Technologies LTD, EuroChem Group, Bayer AG.
Recent Developments by Key Players
Bayer and Kimitec established a new strategic alliance aimed at speeding up the research and commercialization of biological crop protection solutions and biostimulants.
AgBiome and Ginkgo BioWorks partnered recently to provide growers with new and improved live microbial strain products.
AMVAC and NewLeaf Symbiotics collaborated to gain wider market access. This partnership shall focus on enhancing access to value-added biologicals that benefit North American farmers.
The Biostimulants Market report offers a comprehensive market segmentation analysis along with an estimation for the forecast period 2025–2030.
Segments Covered in the Report
- Active Ingredients
- Acid-Based
- Humic Acid
- Amino Acid
- Fulvic Acid
- Extract-Based
- Seaweed Extracts
- Other Botanical Extracts
- Microbial Amendments
- Trace Minerals and Vitamins
- Others
- Acid-Based
- Crop Type
- Cereals & Grains
- Oilseeds & Pulses
- Fruits & Vegetables
- Turfs & Ornamentals
- Others
- Formulation
- Liquid Formulation
- Suspension Concentrates
- Soluble Liquid Concentrates
- Emulsifiable Concentrates
- Dry Formulation
- Dry Granules
- Wettable Powder
- Water Dispersible
- Liquid Formulation
Geographical Segmentation
- North America
- U.S.
- Canada
- Mexico
- Europe
- Germany
- U.K.
- France
- Italy
- Spain
- Russia
- Rest of Europe
- Asia-Pacific (APAC)
- China
- Japan
- India
- South Korea
- Rest of Asia-Pacific
- Rest of the World (RoW)
- Brazil
- Saudi Arabia
- South Africa
- U.A.E.
- Other Countries
.png "Biostimulants Market Size and Market Analysis")
Source: VynZ Research
1. Research Overview
1.1. The Report Offers
1.2. Market Coverage
1.2.1. By Active Ingredients
1.2.2. By Crop Type
1.2.3. By Formulation
1.2.4. By Region
1.3. Research Phases
1.4. Limitations
1.5. Market Methodology
1.5.1. Data Sources
1.5.1.1. Primary Research
1.5.1.2. Secondary Research
1.5.2. Methodology
1.5.2.1. Data Exploration
1.5.2.2. Forecast Parameters
1.5.2.3. Data Validation
1.5.2.4. Assumptions
1.5.3. Study Period & Data Reporting Unit
2. Executive Summary
3. Industry Overview
3.1. Industry Dynamics
3.1.1. Market Growth Drivers
3.1.2. Market Restraints
3.1.3. Key Market Trends
3.1.4. Major Opportunities
3.2. Industry Ecosystem
3.2.1. Porter’s Five Forces Analysis
3.2.2. Recent Development Analysis
3.2.3. Value Chain Analysis
3.3. Competitive Insight
3.3.1. Competitive Position of Industry Players
3.3.2. Market Attractive Analysis
3.3.3. Market Share Analysis
4. Global Market Estimate and Forecast
4.1. Global Market Overview
4.2. Global Market Estimate and Forecast to 2030
5. Market Segmentation Estimate and Forecast
5.1. By Active Ingredients
5.1.1. Acid-based
5.1.1.1. Humic Acid
5.1.1.1.1. Market Definition
5.1.1.1.2. Market Estimation and Forecast to 2030
5.1.1.2. Amino Acid
5.1.1.2.1. Market Definition
5.1.1.2.2. Market Estimation and Forecast to 2030
5.1.1.3. Fulvic Acid
5.1.1.3.1. Market Definition
5.1.1.3.2. Market Estimation and Forecast to 2030
5.1.2. Extract-based
5.1.2.1. Seaweed Extracts
5.1.2.1.1. Market Definition
5.1.2.1.2. Market Estimation and Forecast to 2030
5.1.2.2. Other Botanical Extracts
5.1.2.2.1. Market Definition
5.1.2.2.2. Market Estimation and Forecast to 2030
5.1.3. Microbial Amendments
5.1.3.1. Market Definition
5.1.3.2. Market Estimation and Forecast to 2030
5.1.4. Trace Minerals and Vitamins
5.1.4.1. Market Definition
5.1.4.2. Market Estimation and Forecast to 2030
5.1.5. Others
5.1.5.1. Market Definition
5.1.5.2. Market Estimation and Forecast to 2030
5.2. By Crop Type
5.2.1. Cereals & Grains
5.2.1.1. Market Definition
5.2.1.2. Market Estimation and Forecast to 2030
5.2.2. Oilseeds & Pulses
5.2.2.1. Market Definition
5.2.2.2. Market Estimation and Forecast to 2030
5.2.3. Fruits & Vegetables
5.2.3.1. Market Definition
5.2.3.2. Market Estimation and Forecast to 2030
5.2.4. Turfs & Ornamentals
5.2.4.1. Market Definition
5.2.4.2. Market Estimation and Forecast to 2030
5.2.5. Others
5.2.5.1. Market Definition
5.2.5.2. Market Estimation and Forecast to 2030
5.3. By Formulation
5.3.1. Liquid Formulation
5.3.1.1. Market Definition
5.3.1.2. Market Estimation and Forecast to 2030
5.3.2. Dry Formulation
5.3.2.1. Market Definition
5.3.2.2. Market Estimation and Forecast to 2030
6. North America Market Estimate and Forecast
6.1. By Active Ingredients
6.2. By Crop Type
6.3. By Formulation
6.4. By Country
6.4.1. U.S. Market Estimate and Forecast
6.4.2. Canada Market Estimate and Forecast
6.4.3. Mexico Market Estimate and Forecast
7. Europe Market Estimate and Forecast
7.1. By Active Ingredients
7.2. By Crop Type
7.3. By Formulation
7.4. By Country
7.4.1. Germany Market Estimate and Forecast
7.4.2. France Market Estimate and Forecast
7.4.3. U.K. Market Estimate and Forecast
7.4.4. Italy Market Estimate and Forecast
7.4.5. Spain Market Estimate and Forecast
7.4.6. Rest of Europe Market Estimate and Forecast
8. Asia-Pacific Market Estimate and Forecast
8.1. By Active Ingredients
8.2. By Crop Type
8.3. By Formulation
8.4. By Country
8.4.1. China Market Estimate and Forecast
8.4.2. Japan Market Estimate and Forecast
8.4.3. India Market Estimate and Forecast
8.4.4. South Korea Market Estimate and Forecast
8.4.5. Singapore Market Estimate and Forecast
8.4.6. Rest of Asia-Pacific Market Estimate and Forecast
9. Rest of the World (RoW) Market Estimate and Forecast
9.1. By Active Ingredients
9.2. By Crop Type
9.3. By Formulation
9.4. By Country
9.4.1. Brazil Market Estimate and Forecast
9.4.2. Saudi Arabia Market Estimate and Forecast
9.4.3. South Africa Market Estimate and Forecast
9.4.4. Other Countries Market Estimate and Forecast
10. Company Profiles
10.1. BASF SE
10.1.1. Snapshot
10.1.2. Overview
10.1.3. Offerings
10.1.4. Financial Insight
10.1.5. Recent Developments
10.2. UPL
10.2.1. Snapshot
10.2.2. Overview
10.2.3. Offerings
10.2.4. Financial Insight
10.2.5. Recent Developments
10.3. Valagro
10.3.1. Snapshot
10.3.2. Overview
10.3.3. Offerings
10.3.4. Financial Insight
10.3.5. Recent Developments
10.4. Gowan Company
10.4.1. Snapshot
10.4.2. Overview
10.4.3. Offerings
10.4.4. Financial Insight
10.4.5. Recent Developments
10.5. FMC Corporation
10.5.1. Snapshot
10.5.2. Overview
10.5.3. Offerings
10.5.4. Financial Insight
10.5.5. Recent Developments
10.6. ILSA S.p.A
10.6.1. Snapshot
10.6.2. Overview
10.6.3. Offerings
10.6.4. Financial Insight
10.6.5. Recent Developments
10.7. Rallis India Limited
10.7.1. Snapshot
10.7.2. Overview
10.7.3. Offerings
10.7.4. Financial Insight
10.7.5. Recent Developments
10.8. Haifa Negev Technologies LTD
10.8.1. Snapshot
10.8.2. Overview
10.8.3. Offerings
10.8.4. Financial Insight
10.8.5. Recent Developments
10.9. EuroChem Group
10.9.1. Snapshot
10.9.2. Overview
10.9.3. Offerings
10.9.4. Financial Insight
10.9.5. Recent Developments
10.10. Bayer AG
10.10.1. Snapshot
10.10.2. Overview
10.10.3. Offerings
10.10.4. Financial Insight
10.10.5. Recent Developments
11. Appendix
11.1. Exchange Rates
11.2. Abbreviations
Note: Financial insight and recent developments of different companies are subject to the availability of information in the secondary domain.
List of Tables
Table 1 Sources
Table 2 Study Periods
Table 3 Data Reporting Unit
Table 4 Global Biostimulants Market, Insight by Active Ingredients, 2018–2023 (USD Billion)
Table 5 Global Biostimulants Market, Insight by Active Ingredients, 2025–2030 (USD Billion)
Table 6 Global Biostimulants Market, Insight by Crop Type, 2018–2023 (USD Billion)
Table 7 Global Biostimulants Market, Insight by Crop Type, 2025–2030 (USD Billion)
Table 8 Global Biostimulants Market, Insight by Formulation, 2018–2023 (USD Billion)
Table 9 Global Biostimulants Market, Insight by Formulation, 2025–2030 (USD Billion)
Table 10 Global Biostimulants Market, Insight by Region, 2018–2023 (USD Billion)
Table 11 Global Biostimulants Market, Insight by Region, 2025–2030 (USD Billion)
Table 12 North America Biostimulants Market, Insight by Active Ingredients, 2018–2023 (USD Billion)
Table 13 North America Biostimulants Market, Insight by Active Ingredients, 2025–2030 (USD Billion)
Table 14 North America Biostimulants Market, Insight by Crop Type, 2018–2023 (USD Billion)
Table 15 North America Biostimulants Market, Insight by Crop Type, 2025–2030 (USD Billion)
Table 16 North America Biostimulants Market, Insight by Formulation, 2018–2023 (USD Billion)
Table 17 North America Biostimulants Market, Insight by Formulation, 2025–2030 (USD Billion)
Table 18 North America Biostimulants Market, Insight by Region, 2018–2023 (USD Billion)
Table 19 North America Biostimulants Market, Insight by Region, 2025–2030 (USD Billion)
Table 20 Europe Biostimulants Market, Insight by Active Ingredients, 2018–2023 (USD Billion)
Table 21 Europe Biostimulants Market, Insight by Active Ingredients, 2025–2030 (USD Billion)
Table 22 Europe Biostimulants Market, Insight by Crop Type, 2018–2023 (USD Billion)
Table 23 Europe Biostimulants Market, Insight by Crop Type, 2025–2030 (USD Billion)
Table 24 Europe Biostimulants Market, Insight by Formulation, 2018–2023 (USD Billion)
Table 25 Europe Biostimulants Market, Insight by Formulation, 2025–2030 (USD Billion)
Table 26 Europe Biostimulants Market, Insight by Region, 2018–2023 (USD Billion)
Table 27 Europe Biostimulants Market, Insight by Region, 2025–2030 (USD Billion)
Table 28 Asia-Pacific Biostimulants Market, Insight by Active Ingredients, 2018–2023 (USD Billion)
Table 29 Asia-Pacific Biostimulants Market, Insight by Active Ingredients, 2025–2030 (USD Billion)
Table 30 Asia-Pacific Biostimulants Market, Insight by Crop Type, 2018–2023 (USD Billion)
Table 31 Asia-Pacific Biostimulants Market, Insight by Crop Type, 2025–2030 (USD Billion)
Table 32 Asia-Pacific Biostimulants Market, Insight by Formulation, 2018–2023 (USD Billion)
Table 33 Asia-Pacific Biostimulants Market, Insight by Formulation, 2025–2030 (USD Billion)
Table 34 Asia-Pacific Biostimulants Market, Insight by Region, 2018–2023 (USD Billion)
Table 35 Asia-Pacific Biostimulants Market, Insight by Region, 2025–2030 (USD Billion)
Table 36 RoW Biostimulants Market, Insight by Active Ingredients, 2018–2023 (USD Billion)
Table 37 RoW Biostimulants Market, Insight by Active Ingredients, 2025–2030 (USD Billion)
Table 38 RoW Biostimulants Market, Insight by Crop Type, 2018–2023 (USD Billion)
Table 39 RoW Biostimulants Market, Insight by Crop Type, 2025–2030 (USD Billion)
Table 40 RoW Biostimulants Market, Insight by Formulation, 2018–2023 (USD Billion)
Table 41 RoW Biostimulants Market, Insight by Formulation, 2025–2030 (USD Billion)
Table 42 RoW Biostimulants Market, Insight by Region, 2018–2023 (USD Billion)
Table 43 RoW Biostimulants Market, Insight by Region, 2025–2030 (USD Billion)
Table 44 Snapshot – BASF SE
Table 45 Snapshot – UPL
Table 46 Snapshot – Valagro
Table 47 Snapshot – Gowan Company
Table 48 Snapshot – FMC Corporation
Table 49 Snapshot – ILSA S.p.A
Table 50 Snapshot – Rallis India Limited
Table 51 Snapshot – Haifa Negev Technologies LTD
Table 52 Snapshot – EuroChem Group
Table 53 Snapshot – Bayer AG
List of Figures
Figure 1 Market Coverage
Figure 2 Research Phases
Figure 3 Secondary Sources for Different Parameters
Figure 4 Methodology
Figure 5 Data Mining & Exploration
Figure 6 Data Triangulation
Figure 7 Assumptions for Market Estimation and Forecast
Figure 8 Market Synopsis
Figure 9 Global Biostimulants Market - Growth Drivers and Restraints
Figure 10 Competitive Benchmark
Figure 11 Global Biostimulants Market Highlight
Figure 12 Global Biostimulants Market, Insight by Active Ingredients, 2018 - 2030 (USD Billion)
Figure 13 Global Biostimulants Market, Insight by Crop Type, 2018 - 2030 (USD Billion)
Figure 14 Global Biostimulants Market, Insight by Formulation, 2018 - 2030 (USD Billion)
Figure 15 Global Biostimulants Market, Insight by Region, 2018 - 2030 (USD Billion)
Figure 16 North America Biostimulants Market Highlight
Figure 17 North America Biostimulants Market, Insight by Active Ingredients, 2018 - 2030 (USD Billion)
Figure 18 North America Biostimulants Market, Insight by Crop Type, 2018 - 2030 (USD Billion)
Figure 19 North America Biostimulants Market, Insight by Formulation, 2018 - 2030 (USD Billion)
Figure 20 North America Biostimulants Market, Insight by Region, 2018 - 2030 (USD Billion)
Figure 21 Europe Biostimulants Market Highlight
Figure 22 Europe Biostimulants Market, Insight by Active Ingredients, 2018 - 2030 (USD Billion)
Figure 23 Europe Biostimulants Market, Insight by Crop Type, 2018 - 2030 (USD Billion)
Figure 24 Europe Biostimulants Market, Insight by Formulation, 2018 - 2030 (USD Billion)
Figure 25 North America Biostimulants Market, Insight by Region, 2018 - 2030 (USD Billion)
Figure 26 Asia-Pacific Biostimulants Market Highlight
Figure 27 Asia-Pacific Biostimulants Market, Insight by Active Ingredients, 2018 - 2030 (USD Billion)
Figure 28 Asia-Pacific Biostimulants Market, Insight by Crop Type, 2018 - 2030 (USD Billion)
Figure 29 Asia-Pacific Biostimulants Market, Insight by Formulation, 2018 - 2030 (USD Billion)
Figure 30 North America Biostimulants Market, Insight by Region, 2018 - 2030 (USD Billion)
Figure 31 RoW Biostimulants Market Highlight
Figure 32 RoW Biostimulants Market, Insight by Active Ingredients, 2018 - 2030 (USD Billion)
Figure 33 RoW Biostimulants Market, Insight by Crop Type, 2018 - 2030 (USD Billion)
Figure 34 RoW Biostimulants Market, Insight by Formulation, 2018 - 2030 (USD Billion)
Figure 35 North America Biostimulants Market, Insight by Region, 2018 - 2030 (USD Billion)
Global Biostimulants Market Coverage
Active Ingredients Insight and Forecast 2025-2030
- Acid-Based
- Humic Acid
- Amino Acid
- Fulvic Acid
- Extract-Based
- Seaweed Extracts
- Other Botanical Extracts
- Microbial Amendments
- Trace Minerals and Vitamins
- Others
Crop Type Insight and Forecast 2025-2030
- Cereals & Grains
- Oilseeds & Pulses
- Fruits & Vegetables
- Turfs & Ornamentals
- Others
Formulation Insight and Forecast 2025-2030
- Liquid Formulation
- Suspension Concentrates
- Soluble Liquid Concentrates
- Emulsifiable Concentrates
- Dry Formulation
- Dry Granules
- Wettable Powder
- Water Dispersible
Geographical Segmentation
Biostimulants Market by Region
North America
- By Active Ingredients
- By Crop Type
- By Formulation
- By Country – U.S., Canada, and Mexico
Europe
- By Active Ingredients
- By Crop Type
- By Formulation
- By Country – Germany, U.K., France, Italy, Spain, Russia, and Rest of Europe
Asia-Pacific (APAC)
- By Active Ingredients
- By Crop Type
- By Formulation
- By Country – China, Japan, India, South Korea, and Rest of Asia-Pacific
Rest of the World (RoW)
- By Active Ingredients
- By Crop Type
- By Formulation
- By Country – Brazil, Saudi Arabia, South Africa, U.A.E., and Other Countries
Vynz Research know in your business needs, you required specific answers pertaining to the market, Hence, our experts and analyst can provide you the customized research support on your specific needs.
After the purchase of current report, you can claim certain degree of free customization within the scope of the research.
Please let us know, how we can serve you better with your specific requirements to your research needs. Vynz research promises for quick reversal for your current business requirements.
Purchase Options
Latest Report
Research Methodology
- Desk Research / Pilot Interviews
- Build Market Size Model
- Research and Analysis
- Final Deliverabvle
Connect With Our Sales Team
- Toll-Free: 1 888 253 3960
- Phone: +91 9960 288 381
- Email: enquiry@vynzresearch.com
Global Biostimulants Market – Analysis and Forecast (2025-2030)
- The global biostimulants market promises a growth from USD 2.9 billion to USD 5.9 billion by 2030 at a rate of 12.3%.
- The market is segregated by application, crop type, source, formulation, and active ingredients. Each segment or its subdivisions promise rapid growth during the forecast period.
- Biostimulants are adopted extensively in organic farming practices along with organic manure by the agriculture industry to improve soil fertility and plant health.
- High cost and lack of regulation of commercialization of low-quality biostimulant products poses challenges to the market but increase in public awareness and government initiatives creates new growth opportunities.
- Europe is the larger share contributor due to sustainable agricultural practices and continual development but the Asia-Pacific market will grow faster due to rising population and high dependency on agricultural sector.