Status : Published | Published On : Dec, 2023 | Report Code : VRCH2103 | Industry : Chemicals & Materials | Available Format :
![]() |
Page : 200 |
Flame-retardant materials are designed to inhibit or delay the spread of fire and are composed of substances that impede combustion by either releasing fire-extinguishing gases or forming a protective barrier. These materials undergo chemical treatments or incorporate specialized additives to enhance their fire resistance. When exposed to high temperatures, they react to suppress flames, reducing the likelihood of rapid-fire propagation. Commonly used in textiles, plastics, and construction materials, flame-retardants play a crucial role in enhancing safety in environments where fire risk is a concern; however, there is ongoing research to ensure these materials are effective while minimizing potential environmental and health impacts from their use.
Global flame-retardant materials market was worth USD 7.10 billion in 2023 and is expected reach USD 11.60 billion by 2030 with a CAGR of 5.45% during the forecast period, i.e., 2023-2030. Flame-retardant materials demand is rising due to stringent fire safety regulations, increasing awareness of fire hazards, expanding construction and automotive industries, and growing demand for electronics and electrical equipment, all necessitating fire-resistant materials to enhance safety and compliance.
Geographically, the market is expanding rapidly in North America, Europe and the Asia Pacific, as a result of the heightened awareness of fire hazards, robust industrial sectors, and a surge in construction activities demanding fire-resistant materials for enhanced safety and compliance; however, the market confronts constraints such as concerns over certain formulations, regulatory complexities, cost implications for manufacturers. Overall, the global flame-retardant materials market offers potential prospects for market participants to develop and fulfill the growing needs of wide range of industries including transportation, energy storage, consumer electronics, and other industries.
Insight by Type
Based on the type, the global flame-retardant materials market is segmented into Brominated, Nitrogen, Chlorinated, Phosphorous, Antimony Oxide, Aluminum Trihydrate, and others. In 2022, Aluminum Trihydrate dominated the global flame-retardant materials market due to its exceptional fire-retardant properties and widespread availability. Many key players in the industry have formed strategic partnerships and collaborations to secure a consistent supply chain of ATH. They've also established production plants in regions of high demand, bolstering their market presence. Additionally, substantial investments in research and development have led to innovations in ATH-based formulations, further solidifying its prominence. Its versatility, cost-effectiveness, and compliance with environmental regulations make it a preferred choice, driving its market dominance in fire-retardant applications across various industries.
Insight by Application
Based on the application, the global flame-retardant materials market is segmented into Polyolefin, Epoxy, PVC, Rubber, and others. In 2022, epoxy-based materials dominated the global flame-retardant materials market due to their exceptional fire-resisting properties. These materials possess high thermal stability, low flammability, and self-extinguishing capabilities, making them highly effective in preventing fire spread. Additionally, epoxies form durable, heat-resistant coatings, providing an added layer of protection and the versatility allows for application in diverse industries, including electronics, aerospace, and construction. Moreover, epoxy-based flame retardants can be tailored to meet specific fire safety standards, enhancing their appeal. With these properties, epoxies stand out as a crucial choice, driving their prevalence and dominance in the global flame-retardant materials market.
Flame-Retardant Materials Market Report Coverage
Report Metric |
Details |
Historical Period |
2018–2023 |
Base Year Considered |
2024 |
Forecast Period |
2025 - 2030 |
Market Size in 2023 |
$7.10 Billion |
Revenue Forecast in 2030 |
$11.60 Billion |
Growth Rate |
CAGR 5.45% |
Segments Covered in the Report |
By Type, and By Application |
Report Scope |
Market Trends, Drivers, and Restraints; Revenue Estimation and Forecast; Segmentation Analysis; Impact of COVID-19; Companies’ Strategic Developments; Market Share Analysis of Key Players; Company Profiling |
Regions Covered in the Report |
North America, Europe, Asia-Pacific, Middle East, and Rest of the World |
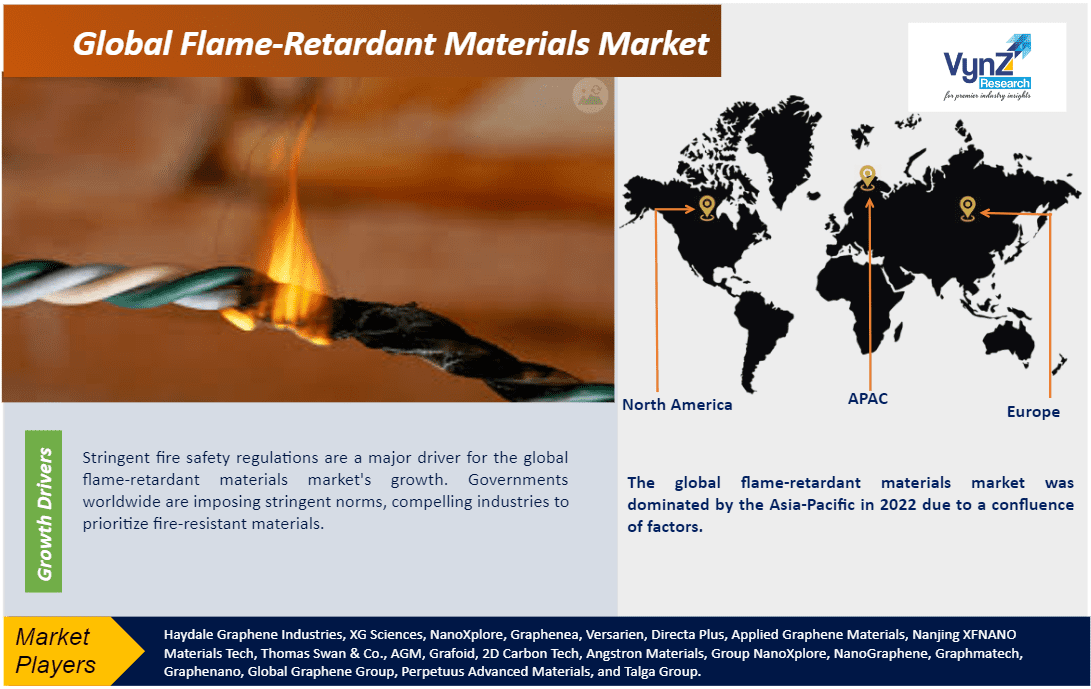
Stringent fire safety regulations are a major driver for the global flame-retardant materials market's growth. Governments worldwide are imposing stringent norms, compelling industries to prioritize fire-resistant materials. For instance, the EU's REACH regulation restricts hazardous substances in products, driving the adoption of safer flame-retardant alternatives. Additionally, recent regulations in construction and automotive sectors mandate the use of fire-resistant materials to enhance safety standards. This surge in demand has prompted significant investments in research and development, leading to advanced flame-retardant formulations. As a result, the global flame-retardant materials market experiences substantial expansion as industries aligns with these regulations to ensure heightened fire safety measures.
The burgeoning construction industry is a pivotal driver for the global flame-retardant materials market. As urbanization accelerates, there's an escalating demand for fire-resistant materials in building structures. Stringent regulations, like the US Building Codes and European Construction Products Regulation, mandate the incorporation of flame-retardant materials in construction. This compels builders and contractors to invest in fire-safe solutions to meet compliance standards. Additionally, the industry's shift towards sustainable and eco-friendly building materials further propels the demand for innovative, environmentally-conscious flame-retardant options. This convergence of regulatory pressure and industry trends underscores the pivotal role of the construction sector in propelling the flame-retardant materials market's growth.
A significant challenge for the global flame-retardant materials market lies in the environmental impact of certain formulations. Some traditional flame-retardant compounds, like halogenated and organophosphorous formulations, can have adverse effects on ecosystems and human health. Their production and disposal contribute to pollution and pose potential risks. This has prompted a shift towards eco-friendly alternatives, driving research into more sustainable flame-retardant materials. Moreover, balancing fire safety with environmental concerns remains a crucial challenge, requiring ongoing innovation and regulation to ensure the market's sustainable growth while mitigating its environmental footprint. This transition represents a critical phase for the global flame-retardant materials market’s long-term viability and environmental stewardship.
North America
Europe
Asia Pacific (APAC)
Latin America
Middle East and Africa (MEA)
The global Flame-retardant materials market is segmented into North America, Europe, the Asia-Pacific, and rest of the world region. The global flame-retardant materials market was dominated by the Asia-Pacific in 2022 due to a confluence of factors. Key industry players have forged strategic partnerships with local firms, ensuring a robust supply chain and have established production plants in proximity to burgeoning markets, optimizing production and distribution. Substantial investments in research and development lead to tailored solutions, addressing specific regional fire safety needs. For instance, in October 2023, LG Chem announced that they have developed a new flame-retardant material to prevent battery explosion. Moreover, a surge in demand from end-use industries, including electronics and construction, amplifies market growth. This dynamic interplay of partnerships, strategic investments, and burgeoning demand solidifies Asia-Pacific's pivotal role in propelling the flame-retardant materials market forward.
Clariant AG stands as one of the leading players in the global flame-retardant materials market. The Swiss specialty chemicals company has demonstrated its commitment to this sector through strategic investments and partnerships. Their Exolit product line, known for its high-performance flame-retardant solutions, has further solidified Clariant's position as an industry leader. Furthermore, Clariant has established production plants worldwide, including facilities in China and other Asian countries, bolstering its global presence and ensuring a robust supply chain. For instance, the company inaugurated a new flame-retardant production plant in China in October 2023. This concerted effort, coupled with a reputation for innovation and quality, reaffirms Clariant's pivotal role in providing cutting-edge flame-retardant solutions to diverse industries worldwide.
Albemarle Corporation is another leading player in the global flame-retardant materials market. Renowned for its extensive portfolio of specialty chemicals, Albemarle offers a range of flame retardants that cater to diverse industries. Their steadfast commitment is evident in strategic investments and partnerships, ensuring a robust supply chain and innovative solutions. Notably, Albemarle's Firemaster product line has become synonymous with high-performance flame-retardant solutions. With a global presence and production facilities strategically located, including plants in the US and Europe, Albemarle reinforces its status as a key player in the global flame-retardant materials market.
Recent Development by Key Players
In October 2023, Clariant inaugurated a new state-of-the-art production facility for halogen-free flame retardants in Daya Bay, Huizhou, as part of its China strategy with an investment of USD 67 million. The plant will provide flame-retardant for rapidly growing demand for innovative, sustainable fire protection in e-mobility and other applications. A second line is under construction and expected to be onstream in 2024, representing a further $44 million investment.
In October 2023, Avient launched new PTFE-free and non-halogen Cesa flame retardant additives to help producers of polycarbonate electrical & electronic (E&E) applications prepare for possible future PFAS restrictions. These new flame-retardant additives are part of Avient’s comprehensive portfolio of color and additives solutions.
Key Players Covered in the Report
Akzo Nobel, BASF SE, Chemtura Corporation, Clariant International Ltd., DOW, Eastman Chemical Company, Israel Chemicals Ltd, Albemarle Corporation, Hangzhou Lingrui Chemical Co. Ltd., Hongbaoli Group Co. Ltd., Huntsman International Llc, Lanxess AG, Muby Chemicals, Nabaltec AG, and Sasol Limited.
The Flame-retardant materials market report offers a comprehensive market segmentation analysis along with an estimation for the forecast period 2025–2030.
Segments Covered in the Report
Type
Brominated
Nitrogen
Chlorinated
Phosphorous
Antimony Oxide
Aluminum Trihydrate
Others
Application
Polyolefin
Epoxy
PVC
Rubber
Others
Region Covered in the Report
North America
U.S.
Canada
Mexico
Europe
Germany
U.K.
France
Italy
Spain
Russia
Rest of Europe
Asia-Pacific (APAC)
China
Japan
Vietnam
India
South Korea
Rest of Asia-Pacific
Rest of the World
Middle East and Africa (MEA)
Latin America
Primary Research Interviews Breakdown
1. Research Overview
1.1. The Report Offers
1.2. Market Coverage
1.2.1. By Type
1.2.2. By Application
1.2.3. By Region
1.3. Research Phases
1.4. Limitations
1.5. Market Methodology
1.5.1. Data Sources
1.5.1.1. Primary Research
1.5.1.2. Secondary Research
1.5.2. Methodology
1.5.2.1. Data Exploration
1.5.2.2. Forecast Parameters
1.5.2.3. Data Validation
1.5.2.4. Assumptions
1.5.3. Study Period & Data Reporting Unit
2. Executive Summary
3. Industry Overview
3.1. Industry Dynamics
3.1.1. Market Growth Drivers
3.1.2. Market Restraints
3.1.3. Key Market Trends
3.1.4. Major Opportunities
3.2. Industry Ecosystem
3.2.1. Porter’s Five Forces Analysis
3.2.2. Recent Development Analysis
3.2.3. Value Chain Analysis
3.3. Competitive Insight
3.3.1. Competitive Position of Industry Players
3.3.2. Market Attractive Analysis
3.3.3. Market Share Analysis
4. Global Market Estimate and Forecast
4.1. Global Market Overview
4.2. Global Market Estimate and Forecast to 2030
5. Market Segmentation Estimate and Forecast
5.1. By Type
5.1.1. Brominated
5.1.1.1. Market Definition
5.1.1.2. Market Estimation and Forecast to 2030
5.1.2. Nitrogen
5.1.2.1. Market Definition
5.1.2.2. Market Estimation and Forecast to 2030
5.1.3. Recycled Content Packaging
5.1.3.1. Market Definition
5.1.3.2. Market Estimation and Forecast to 2030
5.1.4. Chlorinated
5.1.4.1. Market Definition
5.1.4.2. Market Estimation and Forecast to 2030
5.1.5. Phosphorous
5.1.5.1. Market Definition
5.1.5.2. Market Estimation and Forecast to 2030
5.1.6. Antimony Oxide
5.1.6.1. Market Definition
5.1.6.2. Market Estimation and Forecast to 2030
5.1.7. Aluminum Trihydrate
5.1.7.1. Market Definition
5.1.7.2. Market Estimation and Forecast to 2030
5.2. By Application
5.2.1. Polyolefin
5.2.1.1. Market Definition
5.2.1.2. Market Estimation and Forecast to 2030
5.2.2. Epoxy
5.2.2.1. Market Definition
5.2.2.2. Market Estimation and Forecast to 2030
5.2.3. PVC
5.2.3.1. Market Definition
5.2.3.2. Market Estimation and Forecast to 2030
5.2.4. Rubber
5.2.4.1. Market Definition
5.2.4.2. Market Estimation and Forecast to 2030
6. North America Market Estimate and Forecast
6.1. By Type
6.2. By Application
6.3. By Country
6.3.1. U.S. Market Estimate and Forecast
6.3.2. Canada Market Estimate and Forecast
6.3.3. Mexico Market Estimate and Forecast
7. Europe Market Estimate and Forecast
7.1. By Type
7.2. By Application
7.3. By Country
7.3.1. Germany Market Estimate and Forecast
7.3.2. France Market Estimate and Forecast
7.3.3. U.K. Market Estimate and Forecast
7.3.4. Italy Market Estimate and Forecast
7.3.5. Spain Market Estimate and Forecast
7.3.6. Rest of Europe Market Estimate and Forecast
8. Asia-Pacific Market Estimate and Forecast
8.1. By Type
8.2. By C
8.3. By Country
8.3.1. China Market Estimate and Forecast
8.3.2. Japan Market Estimate and Forecast
8.3.3. India Market Estimate and Forecast
8.3.4. South Korea Market Estimate and Forecast
8.3.5. Singapore Market Estimate and Forecast
8.3.6. Rest of Asia-Pacific Market Estimate and Forecast
9. Rest of the World (RoW) Market Estimate and Forecast
9.1. By Type
9.2. By Application
9.3. By Country
9.3.1. Brazil Market Estimate and Forecast
9.3.2. Saudi Arabia Market Estimate and Forecast
9.3.3. South Africa Market Estimate and Forecast
9.3.4. Other Countries Market Estimate and Forecast
10. Company Profiles
10.1. Akzo Nobel
10.1.1. Snapshot
10.1.2. Overview
10.1.3. Offerings
10.1.4. Financial Insight
10.1.5. Recent Developments
10.2. BASF SE
10.2.1. Snapshot
10.2.2. Overview
10.2.3. Offerings
10.2.4. Financial Insight
10.2.5. Recent Developments
10.3. Chemtura Corporation
10.3.1. Snapshot
10.3.2. Overview
10.3.3. Offerings
10.3.4. Financial Insight
10.3.5. Recent Developments
10.4. Clariant International Ltd.
10.4.1. Snapshot
10.4.2. Overview
10.4.3. Offerings
10.4.4. Financial Insight
10.4.5. Recent Developments
10.5. DOW
10.5.1. Snapshot
10.5.2. Overview
10.5.3. Offerings
10.5.4. Financial Insight
10.5.5. Recent Developments
10.6. Eastman Chemical Company
10.6.1. Snapshot
10.6.2. Overview
10.6.3. Offerings
10.6.4. Financial Insight
10.6.5. Recent Developments
10.7. Israel Chemicals Ltd
10.7.1. Snapshot
10.7.2. Overview
10.7.3. Offerings
10.7.4. Financial Insight
10.7.5. Recent Developments
10.8. Albemarle Corporation
10.8.1. Snapshot
10.8.2. Overview
10.8.3. Offerings
10.8.4. Financial Insight
10.8.5. Recent Developments
10.9. Hangzhou Lingrui Chemical Co. Ltd.
10.9.1. Snapshot
10.9.2. Overview
10.9.3. Offerings
10.9.4. Financial Insight
10.9.5. Recent Developments
10.10. Hongbaoli Group Co. Ltd.
10.10.1. Snapshot
10.10.2. Overview
10.10.3. Offerings
10.10.4. Financial Insight
10.10.5. Recent Developments
10.11. Huntsman International Llc
10.11.1. Snapshot
10.11.2. Overview
10.11.3. Offerings
10.11.4. Financial Insight
10.11.5. Recent Developments
10.12 Lanxess AG
10.12.1. Snapshot
10.12.2. Overview
10.12.3. Offerings
10.12.4. Financial Insight
10.12.5. Recent Developments
10.13. Muby Chemicals
10.13.1. Snapshot
10.13.2. Overview
10.13.3. Offerings
10.13.4. Financial Insight
10.13.5. Recent Developments
10.14 Nabaltec AG
10.14.1. Snapshot
10.14.2. Overview
10.14.3. Offerings
10.14.4. Financial Insight
10.14.5. Recent Developments
10.15. Sasol Limited
10.15.1. Snapshot
10.15.2. Overview
10.15.3. Offerings
10.15.4. Financial Insight
10.15.5. Recent Developments
11. Appendix
11.1. Exchange Rates
11.2. Abbreviations
Note: Financial insight and recent developments of different companies are subject to the availability of information in the secondary domain.
List of Tables
Table 1 Sources
Table 2 Study Periods
Table 3 Data Reporting Unit
Table 4 Global Flame-Retardant Materials Market Size, by Type, 2018 – 2023 (USD Billion)
Table 5 Global Flame-Retardant Materials Market Size, by Type, 2025 – 2030 (USD Billion)
Table 6 Global Flame-Retardant Materials Market Size, by Application, 2018 – 2023 (USD Billion)
Table 7 Global Flame-Retardant Materials Market Size, by Application, 2025 – 2030 (USD Billion)
Table 10 Global Flame-Retardant Materials Market Size, by Region, 2018 – 2023 (USD Billion)
Table 11 Global Flame-Retardant Materials Market Size, by Region, 2025 – 2030 (USD Billion)
Table 12 North America Flame-Retardant Materials Market Size, by Type, 2018 – 2023 (USD Billion)
Table 13 North America Flame-Retardant Materials Market Size, by Type, 2025 – 2030 (USD Billion)
Table 14 North America Flame-Retardant Materials Market Size, by Application, 2018 - 2023 (USD Billion)
Table 15 North America Flame-Retardant Materials Market Size, by Application, 2025 - 2030 (USD Billion)
Table 18 North America Flame-Retardant Materials Market Size, by Country, 2018 – 2023 (USD Billion)
Table 19 North America Flame-Retardant Materials Market Size, by Country, 2025 – 2030 (USD Billion)
Table 20 Europe Flame-Retardant Materials Market Size, by Type, 2018 – 2023 (USD Billion)
Table 21 Europe Flame-Retardant Materials Market Size, by Type, 2025 – 2030 (USD Billion)
Table 22 Europe Flame-Retardant Materials Market Size, by Application, 2018 – 2023 (USD Billion)
Table 23 Europe Flame-Retardant Materials Market Size, by Application, 2025 – 2030 (USD Billion)
Table 26 Europe Flame-Retardant Materials Market Size, by Country, 2018 – 2023 (USD Billion)
Table 27 Europe Flame-Retardant Materials Market Size, by Country, 2025 – 2030 (USD Billion)
Table 28 Asia-Pacific Flame-Retardant Materials Market Size, by Type, 2018 – 2023 (USD Billion)
Table 29 Asia-Pacific Flame-Retardant Materials Market Size, by Type, 2025 – 2030 (USD Billion)
Table 30 Asia-Pacific Flame-Retardant Materials Market Size, by Application, 2018 - 2023 (USD Billion)
Table 31 Asia-Pacific Flame-Retardant Materials Market Size, by Application, 2025 - 2030 (USD Billion)
Table 34 Asia-Pacific Flame-Retardant Materials Market Size, by Country, 2018 – 2023 (USD Billion)
Table 35 Asia-Pacific Flame-Retardant Materials Market Size, by Country, 2025 – 2030 (USD Billion)
Table 36 RoW Flame-Retardant Materials Market Size, by Type, 2018 – 2023 (USD Billion)
Table 37 RoW Flame-Retardant Materials Market Size, by Type, 2025 – 2030 (USD Billion)
Table 38 RoW Flame-Retardant Materials Market Size, by Application, 2018 – 2023 (USD Billion)
Table 39 RoW Flame-Retardant Materials Market Size, by Application, 2025 – 2030 (USD Billion)
Table 42 RoW Flame-Retardant Materials Market Size, by Country, 2018 – 2023 (USD Billion)
Table 43 RoW Flame-Retardant Materials Market Size, by Country, 2025 – 2030 (USD Billion)
Table 44 Snapshot – Akzo Nobel
Table 45 Snapshot – BASF SE
Table 46 Snapshot – Chemtura Corporation
Table 47 Snapshot – Clariant International Ltd.
Table 48 Snapshot – DOW
Table 49 Snapshot – Eastman Chemical Company
Table 50 Snapshot – Israel Chemicals Ltd
Table 51 Snapshot – Albemarle Corporation
Table 52 Snapshot – Hangzhou Lingrui Chemical Co.
Table 53 Snapshot – Hongbaoli Group Co. Ltd.
Table 54 Snapshot – Huntsman International Llc
Table 55 Snapshot – Lanxess AG
Table 56 Snapshot – Muby Chemicals
Table 57 Snapshot – Nabaltec AG
Table 58 Snapshot – Sasol Limited
List of Figures
Figure 1 Market Coverage
Figure 2 Research Phases
Figure 3 Secondary Sources for Different Parameters
Figure 4 Methodology
Figure 5 Data Mining & Exploration
Figure 6 Data Triangulation
Figure 7 Assumptions for Market Estimation and Forecast
Figure 8 Market Synopsis
Figure 9 Global Flame-Retardant Materials Market Market - Growth Drivers and Restraints
Figure 10 Competitive Benchmark
Figure 11 Global Flame-Retardant Materials Market Market Highlight
Figure 12 Global Flame-Retardant Materials Market Market Size, By Type, 2018 - 2030 (USD Billion)
Figure 13 Global Flame-Retardant Materials Market Market Size, by Application, 2018 - 2030 (USD Billion)
Figure 15 Global Flame-Retardant Materials Market Market Size, by Region, 2018 - 2030 (USD Billion)
Figure 16 North America Flame-Retardant Materials Market Market Highlight
Figure 17 North America Flame-Retardant Materials Market Market Size, By Type, 2018 - 2030 (USD Billion)
Figure 18 North America Flame-Retardant Materials Market Market Size, by Application, 2018 - 2030 (USD Billion)
Figure 20 North America Flame-Retardant Materials Market Market Size, by Country, 2018 - 2030 (USD Billion)
Figure 21 Europe Flame-Retardant Materials Market Market Highlight
Figure 22 Europe Flame-Retardant Materials Market Market Size, By Type, 2018 - 2030 (USD Billion)
Figure 23 Europe Flame-Retardant Materials Market Market Size, by Application, 2018 - 2030 (USD Billion)
Figure 25 Europe Flame-Retardant Materials Market Market Size, by Country, 2018 - 2030 (USD Billion)
Figure 26 Asia-Pacific Flame-Retardant Materials Market Market Highlight
Figure 27 Asia-Pacific Flame-Retardant Materials Market Market Size, By Type, 2018 - 2030 (USD Billion)
Figure 28 Asia-Pacific Flame-Retardant Materials Market Market Size, by Application, 2018 - 2030 (USD Billion)
Figure 30 Asia-Pacific Flame-Retardant Materials Market Market Size, by Country, 2018 - 2030 (USD Billion)
Figure 31 RoW Flame-Retardant Materials Market Market Highlight
Figure 32 RoW Flame-Retardant Materials Market Market Size, By Type, 2018 - 2030 (USD Billion)
Figure 33 RoW Flame-Retardant Materials Market Market Size, by Application, 2018 - 2030 (USD Billion)
Figure 35 RoW Flame-Retardant Materials Market Market Size, by Country, 2018 - 2030 (USD Billion)
Flame-Retardant Materials Market Coverage
Type Insight and Forecast 2025-2030
Application Insight and Forecast 2025-2030
Flame-Retardant Materials Market by Region
North America
Europe
Asia-Pacific (APAC)
Rest of the World (RoW)
Vynz Research know in your business needs, you required specific answers pertaining to the market, Hence, our experts and analyst can provide you the customized research support on your specific needs.
After the purchase of current report, you can claim certain degree of free customization within the scope of the research.
Please let us know, how we can serve you better with your specific requirements to your research needs. Vynz research promises for quick reversal for your current business requirements.
Purchase Options
Latest Report
Research Methodology
Connect With Our Sales Team
Flame Retardant Materials Market