Status : Published | Published On : Dec, 2023 | Report Code : VRHC1244 | Industry : Healthcare | Available Format : | Page : 210 |
During the forecast period 2025-2030, the Global AI-Enabled Medical Imaging Solutions Market was estimated at $0.86 billion in 2023 and is expected to reach $10.74 billion by 2030, rising at a CAGR of 27.5 percent. Increased demand for diagnostic imaging software is expected to lead to market growth in areas such as dentistry, orthopaedics, urology, neurology, and oncology. Demand is expected to be driven by the growing adoption of ultrasound imaging systems to facilitate faster diagnosis, particularly of chronic diseases. In addition, it is anticipated that continuous growth in the field of imaging technology, such as computer-aided diagnosis (CAD), would fuel demand for these platforms. Major players in the AI-enabled medical imaging solutions market include healthcare technology companies, imaging equipment manufacturers, and software developers. These companies often collaborate with healthcare providers and research institutions to validate and refine their AI algorithms and ensure regulatory compliance.
Market Segmentation
By Clinical Applications
• Breast
• Lung
• Neurology
• Cardiovascular
• Liver
• Prostate
• Colon
• Musculoskeletal
• Others
Due to the growing prevalence of cardiovascular and congenital heart diseases and increasing government funding to enhance the accessibility of treatments, the cardiology segment accounted for the majority of the revenue of around 21.0 percent in 2019. In the coming years, the oncology and mammography segments are expected to experience substantial growth as the incidence of cancer rises at an unprecedented pace. This is likely to result in increasing demand over the forecast period for diagnostic solutions.
Based on Workflow
• Image Acquisition
• Image Analysis
• Reporting and Communication
• Predictive Analysis and Risk Assessment
• Detection
• Triage
• Diagnosis and Treatment Decision Support
It is estimated that the image analysis workflow segment will dominate the market in the forecast period as it involves machine learning to understand the AI findings and report abnormalities. It aids the radiologist in making a quicker and more precise diagnosis, which is especially important for time-sensitive conditions like ischemic stroke.
Based on Geographies
• North America
• Europe
• Asia-Pacific (APAC)
• Rest of World
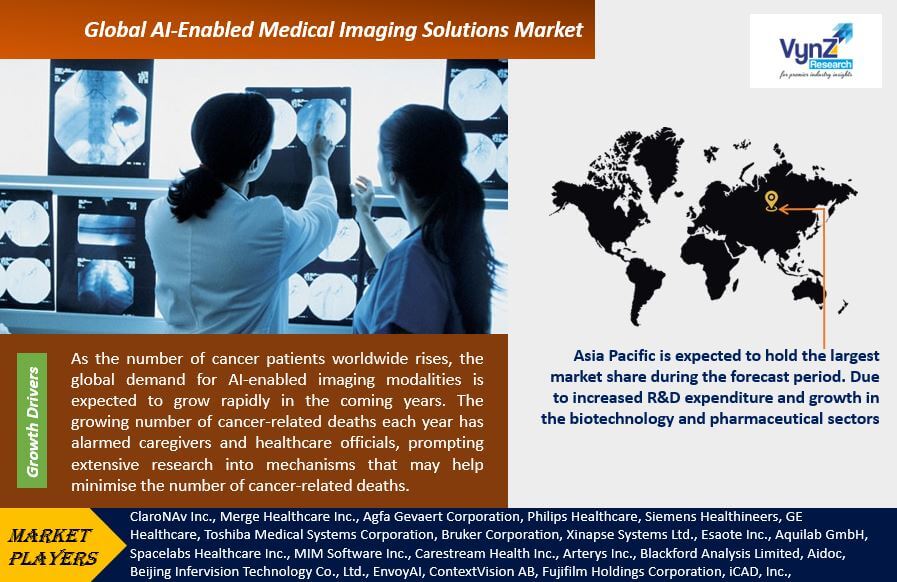
In terms of geographies, Asia Pacific is expected to hold the largest market share during the forecast period. Due to increased R&D expenditure and growth in the biotechnology and pharmaceutical sectors, the Asia Pacific region has led the market. Demand for the market would be triggered by the presence of a large patient pool. Business development would be aided by improved healthcare facilities and high disposable income.
Report Metric |
Details |
Historical Period |
2018 - 2023 |
Base Year Considered |
2025 |
Forecast Period |
2025 - 2030 |
Market Size in 2024 |
U.S.D. 0.86 Billion |
Revenue Forecast in 2030 |
U.S.D. 10.74 Billion |
Growth Rate |
27.5% |
Segments Covered in the Report |
By Clinical Applications and By Workflow |
Report Scope |
Market Trends, Drivers, and Restraints; Revenue Estimation and Forecast; Segmentation Analysis; Impact of COVID-19; Companies’ Strategic Developments; Market Share Analysis of Key Players; Company Profiling |
Regions Covered in the Report |
North America, Europe, Asia-Pacific, Middle East, South America and Rest of the World |
Trends
On the back of increased digitization in developing and developed economies around the world, the global AI-enabled Imaging Modalities market is expected to expand significantly in the coming time zone. Artificial intelligence is driving increased and deeper penetration of cutting-edge Workflow, presenting a plethora of opportunities for the growth of AI, which is expected to gain not only miscellaneous industrial growth but also drive medical imaging modalities globally, especially in developing economies
Computer-aided detection (CAD) systems: These systems use AI algorithms to identify potential abnormalities in medical images and highlight them for further review by radiologists.
Computer-aided diagnosis (CADx) systems: These systems go beyond detection and provide diagnostic recommendations based on the analysis of medical images. They can help in differential diagnosis and treatment planning.
Quantitative imaging analysis tools: These tools use AI algorithms to extract quantitative measurements and biomarkers from medical images, aiding in disease characterization and treatment response assessment.
AI-powered image reconstruction: These solutions leverage AI techniques to enhance the quality of medical images, reduce artifacts, and improve image resolution, leading to more accurate diagnoses.
AI-guided surgical planning: AI algorithms can assist surgeons in preoperative planning by analyzing medical images and providing insights on the optimal surgical approach, anatomical landmarks, and potential risks.
Market Drivers
As the number of cancer patients worldwide rises, the global demand for AI-enabled imaging modalities is expected to grow rapidly in the coming years. The growing number of cancer-related deaths each year has alarmed caregivers and healthcare officials, prompting extensive research into mechanisms that may help minimise the number of cancer-related deaths.
In 2019, the 4D imaging segment accounted for the largest market share of 44.9%. Due to technological developments in 4D imaging technology allowing effective and accurate real-time visualization of the human body, thus removing distortion in procedures, this segment is expected to retain its leading position during the forecast era. A 3-dimensional image processing with real-time movement is 4D imaging. In the forecast era, due to the growing adoption of these technologies, the 3D and 4D imaging software solutions market is likely to experience lucrative growth.
Opportunity
The business environment for AI-enabled imaging modalities is currently undergoing major changes. There is an increase in investment in healthcare infrastructure growth, as well as growing evidence for effective and promising treatment and diagnosis assistance.This is leading too immense growth opportunities. As a result, the demand for AI-enabled imaging modalities could see significant growth. Furthermore, a slew of new players developing AI-powered imaging systems and software companies have entered the healthcare market. Both of these factors have contributed to a major increase in the sales of AI-based imaging modality systems around the world.
Challenges
The main challenges faced by this market consist of physicians' apprehensions about adopting new technology like AI, as well as privacy and security issues about healthcare data As a result, these developments are expected to have a huge effect on the healthcare service robots industry in the next five years, resulting in a multifold increase in market size.
COVID-19 Impact on the AI-Enabled Medical Imaging Solutions Market
Due to the outbreak of the novel coronavirus, healthcare industrialists around the world have experienced a panning out of income effect, which has caused a disruption in the adoption of such innovations, resulting in a drop in market value. However, as the curve for the covid disease flattens, the market is expected to ramp up.
Competitive Insight
Merge Healthcare Solutions Inc. provides web-based medical image and information management systems. The Company offers solutions for ambulatory care facilities, imaging centers and radiology practices. Merge Healthcare Solutions serves the United States healthcare industry.
ClaroNav is a medical device hardware and software company that specializes in surgical navigation products.
Key Players
• ClaroNAv Inc.
• Merge Healthcare Inc.
• Agfa-Gevaert Corporation
• Philips Healthcare
• Siemens Healthineers
• GE Healthcare
• Toshiba Medical Systems Corporation
• Bruker Corporation
• Xinapse Systems Ltd.
• Esaote Inc.
• Aquilab GmbH
• Spacelabs Healthcare Inc.
• MIM Software Inc.
• Carestream Health Inc.
• Arterys Inc.
• Blackford Analysis Limited
• Aidoc
• Beijing Infervision Technology Co., Ltd.
• EnvoyAI
• ContextVision AB
• Fujifilm Holdings Corporation
• iCAD, Inc.
• Nuance Communications, Inc.
Recent Developments by Key Players
ClaroNav has launched Navident EVO, the latest and most advanced dental navigation system. Navident EVO is a dynamic navigation system developed to be a precise, efficient and versatile tool for the dental clinician interested in true precision dentistry.
Philips and Synthetic MR collaborated to deliver breakthrough AI-based quantitative brain imaging in MR to advance neurology care for patients.
The AI-Enabled Medical Imaging Solutions Market report offers a comprehensive market segmentation analysis along with an estimation for the forecast period 2025–2030.
Segments Covered in the Report
Region Covered in the Report
Source: VynZ Research
1. Research Overview
1.1. The Report Offers
1.2. Market Coverage
1.2.1. By Clinical Applications
1.2.2. By Workflow
1.3. Research Phases
1.4. Limitations
1.5. Research Methodology
1.5.1. Data Sources
1.5.1.1. Primary Research
1.5.1.2. Secondary Research
1.5.2. Methodology
1.5.2.1. Data Exploration
1.5.2.2. Forecast Parameters
1.5.2.3. Data Validation
1.5.2.4. Assumptions
1.5.3. Study Period & Data Reporting Unit
2. Executive Summary
3. Industry Overview
3.1. Industry Dynamics
3.1.1. Market Growth Drivers
3.1.2. Market Restraints
3.1.3. Key Market Trends
3.1.4. Major Opportunities
3.2. Industry Ecosystem
3.2.1. Porter’s Five Forces Analysis
3.2.2. Recent Development Analysis
3.2.3. Value Chain Analysis
3.3. Competitive Insight
3.3.1. Competitive Position of Industry Players
3.3.2. Market Attractive Analysis
4. Global Market Estimate and Forecast
4.1. Global Market Overview
4.2. Global Market Estimate and Forecast to 2030
5. Market Segmentation Estimate and Forecast
5.1. By Clinical Applications
5.1.1. Breast
5.1.1.1. Market Definition
5.1.1.2. Market Estimation and Forecast to 2030
5.1.2. Lung
5.1.2.1. Market Definition
5.1.2.2. Market Estimation and Forecast to 2030
5.1.3. Neurology
5.1.3.1. Market Definition
5.1.3.2. Market Estimation and Forecast to 2030
5.1.4. Cardiovascular
5.1.4.1. Market Definition
5.1.4.2. Market Estimation and Forecast to 2030
5.1.5. Liver
5.1.5.1. Market Definition
5.1.5.2. Market Estimation and Forecast to 2030
5.1.6. Prostate
5.1.6.1. Market Definition
5.1.6.2. Market Estimation and Forecast to 2030
5.1.7. Colon
5.1.7.1. Market Definition
5.1.7.2. Market Estimation and Forecast to 2030
5.1.8. Musculoskeletal
5.1.8.1. Market Definition
5.1.8.2. Market Estimation and Forecast to 2030
5.1.9. Others
5.1.9.1. Market Definition
5.1.9.2. Market Estimation and Forecast to 2030
5.2. By Workflow
5.2.1. Image Acquisition
5.2.1.1. Market Definition
5.2.1.2. Market Estimation and Forecast to 2030
5.2.2. Image Analysis
5.2.2.1. Market Definition
5.2.2.2. Market Estimation and Forecast to 2030
5.2.3. Reporting and Communication
5.2.3.1. Market Definition
5.2.3.2. Market Estimation and Forecast to 2030
5.2.4. Predictive Analysis and Risk Assessment
5.2.4.1. Market Definition
5.2.4.2. Market Estimation and Forecast to 2030
5.2.5. Detection
5.2.5.1. Market Definition
5.2.5.2. Market Estimation and Forecast to 2030
5.2.6. Triage
5.2.6.1. Market Definition
5.2.6.2. Market Estimation and Forecast to 2030
5.2.7. Diagnosis and Treatment Decision Support
5.2.7.1. Market Definition
5.2.7.2. Market Estimation and Forecast to 2030
6. North America Market Estimate and Forecast
6.1. By Clinical Applications
6.2. By Workflow
6.3. By Country
6.3.1. U.S. Market Estimate and Forecast
6.3.2. Canada Market Estimate and Forecast
6.3.3. Mexico Market Estimate and Forecast
7. Europe Market Estimate and Forecast
7.1. By Clinical Applications
7.2. By Workflow
7.3. By Country
7.3.1. Germany Market Estimate and Forecast
7.3.2. France Market Estimate and Forecast
7.3.3. U.K. Market Estimate and Forecast
7.3.4. Italy Market Estimate and Forecast
7.3.5. Spain Market Estimate and Forecast
7.3.6. Russia Market Estimate and Forecast
7.3.7. Rest of Europe Market Estimate and Forecast
8. Asia-Pacific Market Estimate and Forecast
8.1. By Clinical Applications
8.2. By Workflow
8.3. By Country
8.3.1. China Market Estimate and Forecast
8.3.2. Japan Market Estimate and Forecast
8.3.3. India Market Estimate and Forecast
8.3.4. South Korea Market Estimate and Forecast
8.3.5. Rest of Asia-Pacific Market Estimate and Forecast
9. Rest of the World (RoW) Market Estimate and Forecast
9.1. By Clinical Applications
9.2. By Workflow
9.3. By Country
9.3.1. Brazil Market Estimate and Forecast
9.3.2. Saudi Arabia Market Estimate and Forecast
9.3.3. South Africa Market Estimate and Forecast
9.3.4. U.A.E. Market Estimate and Forecast
9.3.5. Other Countries Market Estimate and Forecast
10. Company Profiles
10.1. ClaroNAv Inc.
10.1.1. Snapshot
10.1.2. Overview
10.1.3. Offerings
10.1.4. Financial Insight
10.1.5. Recent Developments
10.2. Merge Healthcare Inc.
10.2.1. Snapshot
10.2.2. Overview
10.2.3. Offerings
10.2.4. Financial Insight
10.2.5. Recent Developments
10.3. AGFA-GEVAERT CORPORATION
10.3.1. Snapshot
10.3.2. Overview
10.3.3. Offerings
10.3.4. Financial Insight
10.3.5. Recent Developments
10.4. Philips Healthcare
10.4.1. Snapshot
10.4.2. Overview
10.4.3. Offerings
10.4.4. Financial Insight
10.4.5. Recent Developments
10.5. Siemens Healthineers
10.5.1. Snapshot
10.5.2. Overview
10.5.3. Offerings
10.5.4. Financial Insight
10.5.5. Recent Developments
10.6. GE Healthcare
10.6.1. Snapshot
10.6.2. Overview
10.6.3. Offerings
10.6.4. Financial Insight
10.6.5. Recent Developments
10.7. Toshiba Medical Systems Corporation
10.7.1. Snapshot
10.7.2. Overview
10.7.3. Offerings
10.7.4. Financial Insight
10.7.5. Recent Developments
10.8. Bruker Corporation
10.8.1. Snapshot
10.8.2. Overview
10.8.3. Offerings
10.8.4. Financial Insight
10.8.5. Recent Developments
10.9. Xinapse Systems Ltd
10.9.1. Snapshot
10.9.2. Overview
10.9.3. Offerings
10.9.4. Financial Insight
10.9.5. Recent Developments
10.10. Esaote Inc.
10.10.1. Snapshot
10.10.2. Overview
10.10.3. Offerings
10.10.4. Financial Insight
10.10.5. Recent Developments
10.11. Aquilab GmbH
10.11.1. Snapshot
10.11.2. Overview
10.11.3. Offerings
10.11.4. Financial Insight
10.11.5. Recent Developments
10.12. Spacelabs Healthcare Inc.
10.12.1. Snapshot
10.12.2. Overview
10.12.3. Offerings
10.12.4. Financial Insight
10.12.5. Recent Developments
10.13. MIM Software Inc.
10.13.1. Snapshot
10.13.2. Overview
10.13.3. Offerings
10.13.4. Financial Insight
10.13.5. Recent Developments
10.14. Carestream Health Inc.
10.14.1. Snapshot
10.14.2. Overview
10.14.3. Offerings
10.14.4. Financial Insight
10.14.5. Recent Developments
10.15. Arterys Inc.
10.15.1. Snapshot
10.15.2. Overview
10.15.3. Offerings
10.15.4. Financial Insight
10.15.5. Recent Developments
10.16. Blackford Analysis Limited
10.16.1. Snapshot
10.16.2. Overview
10.16.3. Offerings
10.16.4. Financial Insight
10.16.5. Recent Developments
10.17. Aidoc
10.17.1. Snapshot
10.17.2. Overview
10.17.3. Offerings
10.17.4. Financial Insight
10.17.5. Recent Developments
10.18. Beijing Infervision Technology Co., Ltd.
10.18.1. Snapshot
10.18.2. Overview
10.18.3. Offerings
10.18.4. Financial Insight
10.18.5. Recent Developments
10.19. EnvoyAI
10.19.1. Snapshot
10.19.2. Overview
10.19.3. Offerings
10.19.4. Financial Insight
10.19.5. Recent Developments
10.20. ContextVision AB
10.20.1. Snapshot
10.20.2. Overview
10.20.3. Offerings
10.20.4. Financial Insight
10.20.5. Recent Developments
10.21. Fujifilm Holdings Corporation
10.21.1. Snapshot
10.21.2. Overview
10.21.3. Offerings
10.21.4. Financial Insight
10.21.5. Recent Developments
10.22. iCAD, Inc.
10.22.1. Snapshot
10.22.2. Overview
10.22.3. Offerings
10.22.4. Financial Insight
10.22.5. Recent Developments
10.23. Nuance Communications, Inc.
10.23.1. Snapshot
10.23.2. Overview
10.23.3. Offerings
10.23.4. Financial Insight
10.23.5. Recent Developments
11. Appendix
11.1. Exchange Rates
11.2. Abbreviations
List of Tables
Table 1 Sources
Table 2 Study Periods
Table 3 Data Reporting Unit
Table 4 Global AI-Enabled Medical Imaging Solutions Market Size, By Clinical Applications, 2018 - 2023 (USD Billion)
Table 5 Global AI-Enabled Medical Imaging Solutions Market Size, By Clinical Applications, 2025 - 2030 (USD Billion)
Table 6 Global AI-Enabled Medical Imaging Solutions Market Size, By Workflow, 2018 - 2023 (USD Billion)
Table 7 Global AI-Enabled Medical Imaging Solutions Market Size, By Workflow, 2025 - 2030 (USD Billion)
Table 8 Global AI-Enabled Medical Imaging Solutions Market Size, by Region, 2018 - 2023 (USD Billion)
Table 9 Global AI-Enabled Medical Imaging Solutions Market Size, by Region, 2025 - 2030 (USD Billion)
Table 10 North America AI-Enabled Medical Imaging Solutions Market Size, By Clinical Applications, 2018 - 2023 (USD Billion)
Table 11 North America AI-Enabled Modalities Market Size, By Clinical Applications, 2025 - 2030 (USD Billion)
Table 12 North America AI-Enabled Modalities Market Size, By Workflow Type, 2018 - 2023 (USD Billion)
Table 13 North America AI-Enabled Modalities Market Size, By Workflow Type, 2025 - 2030 (USD Billion)
Table 14 North America AI-Enabled Modalities Market Size, by Region, 2018 - 2023 (USD Billion)
Table 15 North America AI-Enabled Modalities Market Size, by Region, 2025 - 2030 (USD Billion)
Table 16 Europe AI-Enabled Modalities Market Size, By Clinical Applications, 2018 - 2023 (USD Billion)
Table 17 Europe AI-Enabled Modalities Market Size, By Clinical Applications, 2025 - 2030 (USD Billion)
Table 18 Europe AI-Enabled Modalities Market Size, By Workflow Type, 2018 - 2023 (USD Billion)
Table 19 Europe AI-Enabled Modalities Market Size, By Workflow Type, 2025 - 2030 (USD Billion)
Table 20 Europe AI-Enabled Modalities Market Size, by Region, 2015– 2019 (USD Billion)
Table 21 Europe AI-Enabled Modalities Market Size, by Region, 2025 - 2030 (USD Billion)
Table 22 Asia-Pacific AI-Enabled Modalities Market Size, By Clinical Applications, 2018 - 2023 (USD Billion)
Table 23 Asia-Pacific AI-Enabled Modalities Market Size, By Clinical Applications, 2025 - 2030 (USD Billion)
Table 24 Asia-Pacific AI-Enabled Modalities Market Size, By Workflow Type, 2018 - 2023 (USD Billion)
Table 25 Asia-Pacific AI-Enabled Modalities Market Size, By Workflow Type, 2025 - 2030 (USD Billion)
Table 26 Asia-Pacific AI-Enabled Modalities Market Size, by Region, 2018 - 2023 (USD Billion)
Table 27 Asia-Pacific AI-Enabled Modalities Market Size, by Region, 2025 - 2030 (USD Billion)
Table 28 RoW AI-Enabled Modalities Market Size, By Clinical Applications, 2018 - 2023 (USD Billion)
Table 29 RoW AI-Enabled Modalities Market Size, By Clinical Applications, 2025 - 2030 (USD Billion)
Table 30 RoW AI-Enabled Modalities Market Size, By Workflow Type, 2018 - 2023 (USD Billion)
Table 31 RoW AI-Enabled Modalities Market Size, By Workflow Type, 2025 - 2030 (USD Billion)
Table 32 RoW AI-Enabled Modalities Market Size, by Region, 2018 - 2023 (USD Billion)
Table 33 RoW AI-Enabled Modalities Market Size, by Region, 2025 - 2030 (USD Billion)
Table 34 Snapshot – ClaroNAv Inc.
Table 35 Snapshot – Merge Healthcare Inc.
Table 36 Snapshot – AGFA-GEVAERT CORPORATION
Table 37 Snapshot – Philips Healthcare
Table 38 Snapshot – Siemens Healthineers
Table 39 Snapshot – GE Healthcare
Table 40 Snapshot – Toshiba Medical Systems Corporation
Table 41 Snapshot – Bruker Corporation
Table 42 Snapshot – Xinapse Systems Ltd
Table 43 Snapshot – Esaote Inc.
Table 44 Snapshot – Aquilab GmbH
Table 45 Snapshot – Spacelabs Healthcare Inc.
Table 46 Snapshot – MIM Software Inc.
Table 47 Snapshot – Carestream Health Inc.
Table 48 Snapshot – Arterys Inc.
Table 49 Snapshot – Blackford Analysis Limited
Table 50 Snapshot – Aidoc
Table 51 Snapshot – Beijing Infervision Technology Co., Ltd.
Table 52 Snapshot – EnvoyAI
Table 53 Snapshot – ContextVision AB
Table 54 Snapshot – Fujifilm Holdings Corporation
Table 55 Snapshot – iCAD, Inc
Table 56 Snapshot – Nuance Communications, Inc.
List of Figures
Figure 1 Market Coverage
Figure 2 Research Phases
Figure 3 Secondary Sources for Different Parameters
Figure 4 Methodology
Figure 5 Data Mining & Exploration
Figure 6 Data Triangulation
Figure 7 Assumptions for Market Estimation and Forecast
Figure 8 Market Synopsis
Figure 9 Global AI-Enabled Modalities Market - Growth Drivers and Restraints
Figure 10 Competitive Benchmark
Figure 11 Global AI-Enabled Modalities Market Highlight
Figure 12 Global AI-Enabled Medical Imaging Solutions Market Size, By Clinical Applications, 2018 - 2030 (USD Billion)
Figure 13 Global AI-Enabled Medical Imaging Solutions Market Size, By Workflow Type, 2018 - 2030 (USD Billion)
Figure 14 Global AI-Enabled Medical Imaging Solutions Market Size, by Region, 2018 - 2030 (USD Billion)
Figure 15 North America AI-Enabled Modalities Market Highlight
Figure 16 North America AI-Enabled Modalities Market Size, By Clinical Applications, 2018 - 2030 (USD Billion)
Figure 17 North America AI-Enabled Modalities Market Size, By Workflow Type, 2018 - 2030 (USD Billion)
Figure 18 North America AI-Enabled Modalities Market Size, by Region, 2018 - 2030 (USD Billion)
Figure 19 Europe AI-Enabled Modalities Market Highlight
Figure 20 Europe AI-Enabled Modalities Market Size, By Clinical Applications, 2018 - 2030 (USD Billion)
Figure 21 Europe AI-Enabled Modalities Market Size, By Workflow Type, 2018 - 2030 (USD Billion)
Figure 22 Europe AI-Enabled Modalities Market Size, by Region, 2018 - 2030 (USD Billion)
Figure 23 Asia-Pacific AI-Enabled Modalities Market Highlight
Figure 24 Asia-Pacific AI-Enabled Modalities Market Size, By Clinical Applications, 2018 - 2030 (USD Billion)
Figure 25 Asia-Pacific AI-Enabled Modalities Market Size, By Workflow Type, 2018 - 2030 (USD Billion)
Figure 26 Asia-Pacific AI-Enabled Modalities Market Size, by Region, 2018 - 2030 (USD Billion)
Figure 27 RoW AI-Enabled Modalities Market Highlight
Figure 28 RoW AI-Enabled Modalities Market Size, By Clinical Applications, 2018 - 2030 (USD Billion)
Figure 29 RoW AI-Enabled Modalities Market Size, By Workflow Type, 2018 - 2030 (USD Billion)
Figure 30 RoW AI-Enabled Modalities Market Size, by Region, 2018 - 2030 (USD Billion)
Global AI-Enabled Modalities Market Coverage
Clinical Application Insight and Forecast 2025-2030
Workflow Insight and Forecast 2025-2030
Geographical Segmentation
The Global AI-Enabled Modalities by Region
North America
Europe
Asia-Pacific (APAC)
Rest of the World (RoW)
Vynz Research know in your business needs, you required specific answers pertaining to the market, Hence, our experts and analyst can provide you the customized research support on your specific needs.
After the purchase of current report, you can claim certain degree of free customization within the scope of the research.
Please let us know, how we can serve you better with your specific requirements to your research needs. Vynz research promises for quick reversal for your current business requirements.
Purchase Options
Latest Report
Research Methodology
Connect With Our Sales Team
AI-Enabled Medical Imaging Solutions Market