Status : Published | Published On : Jan, 2024 | Report Code : VRSME9090 | Industry : Semiconductor & Electronics | Available Format : | Page : 300 |
The projected growth of the Global Printed Electronics Industry is poised to be significant, with an estimated increase from USD 9.78 billion in 2023 to a remarkable USD 28.3 billion by 2030. This forecast period, spanning from 2025 to 2030, anticipates a compound annual growth rate (CAGR) of 18.4%.
Printed electronics refers to a specialized and more advanced printing technology. It is primarily used in making electronic devices by printing or substrates. The effectiveness of this technology increases its applicability across a wide range of industry verticals such as consumer electronics, automotive, healthcare, and others. Ideally, the growth in consumer demand and its extensive use across different industries have forced the manufacturers of these devices to produce more efficient and lightweight devices of better quality. These include products like smart TVs, antennas, keyboards, and more.
The global printed electronics market is divided by material type into inks and substrates segments, where the segment is further divided into conductive inks, dielectric inks, and more. The conductive inks subsection is further split into conductive silver inks, conductive copper inks, transparent conductive inks, silver copper inks, and carbon inks. On the other hand, the substrates segment is further divided into organic and inorganic substrates, where the organic substrates segment is further segmented into polymers (polyimides, polyethylene naphtholate, and polyethylene terephthalate), paper (polyacrylate, polystyrene, polyvinylpyrrolidone (PVP), and polyvinyl alcohol), and others. The inorganic substrates are further segmented into glass and other inorganic substrates. Out of all these segments and subsegments, the inks segment will dominate the market. It will grow at a high CAGR during the forecast period due to higher usage and adoption in the fabrication process of printed electronics, along with the rise in demand for advanced printing technologies to design compact devices.
According to the printing technology, the global printed electronics market is divided into inkjet printing, screen printing, flexographic printing, gravure printing, and other segments. The inkjet printing segment has other segments like continuous and drop-on-demand inkjet printing, where the latter is further split into thermal, piezo, and electrostatic drop-on-demand inkjet printing. The screen-printing segment has other divisions like flatbed and rotary screen printing. Screen printing segment will dominate the market due to widespread adoption to produce sensors and displays, commercialized devices like laptops and smartphones, to produce photovoltaic (PV) cells, and easy application on multiple flexible and durable inks and dyes. However, inkjet printing will grow significantly due to flexible features, compactness, less material consumption, and lower setup cost.
The global printed electronics market is also divided by resolutions into below 100 lines/cm, 100 To 200 lines/cm, and above 200 lines/cm. Out of these, the latter will grow more during the forecast period at a higher CAGR due to growing adoption to develop new and more functional printed electronics.
Diverse applications also divide the global printed electronics market into displays, RFID tags, batteries, photovoltaic cells, lighting, and other segments. The displays segment is divided further into e-paper displays and electroluminescent (EL) displays, and the former is further split into electrochromic displays, electrophoretic displays, and others. The electroluminescent (EL) displays segment is also subdivided into OLED, flexible OLED, and LCDs. The PV cells are subdivided into sensors, touch sensors, gas sensors, humidity sensors, pressure sensors, image sensors, temperature sensors, and others. The lighting segment is further subdivided into electroluminescent lighting and OLED lighting. Out of these, the lighting segment will grow more since it will replace expensive halogen, tungsten, and fluorescent lamps. The OLED displays will also grow due to higher demand for customized, energy-efficient, and economical lighting and higher investments by the government to develop printed OLED-based lighting. The sensor segment will also grow during the forecast period due to the growing demand for IoT devices across several industry verticals.
Different end users divide the global printed electronics market into automotive, transportation, healthcare, consumer electronics, aerospace, defense, construction, architecture, retail, packaging, and other segments. Among all these segments, the aerospace and defense sector is expected to grow more during the forecast period at a higher CAGR due to lightweight design, higher reliability, simplicity, and fewer maintenance requirements.
Report Metric |
Details |
Historical Period |
2018 - 2023 |
Base Year Considered |
2024 |
Forecast Period |
2025 - 2030 |
Market Size in 2024 |
U.S.D. 9.78 Billion |
Revenue Forecast in 2030 |
U.S.D. 28.3 Billion |
Growth Rate |
18.4% |
Segments Covered in the Report |
By Material, By Printing Technology, By Resolution, Application, and By End User |
Report Scope |
Market Trends, Drivers, and Restraints; Revenue Estimation and Forecast; Segmentation Analysis; Impact of COVID-19; Companies’ Strategic Developments; Market Share Analysis of Key Players; Company Profiling |
Regions Covered in the Report |
North America, Europe, Asia-Pacific, Middle East, and Rest of the World |
There is a significant growth noticed in the electronics industry across the globe. Another significant trend noticed in this industry is the growing demand for next-gen flexible and energy-efficient products. Furthermore, the growing prominence of advanced technologies like IoT and the rise in demand for more sophisticated and feature-rich OLED displays and printed RFID devices have also been noticed, prompting higher usage of this technology.
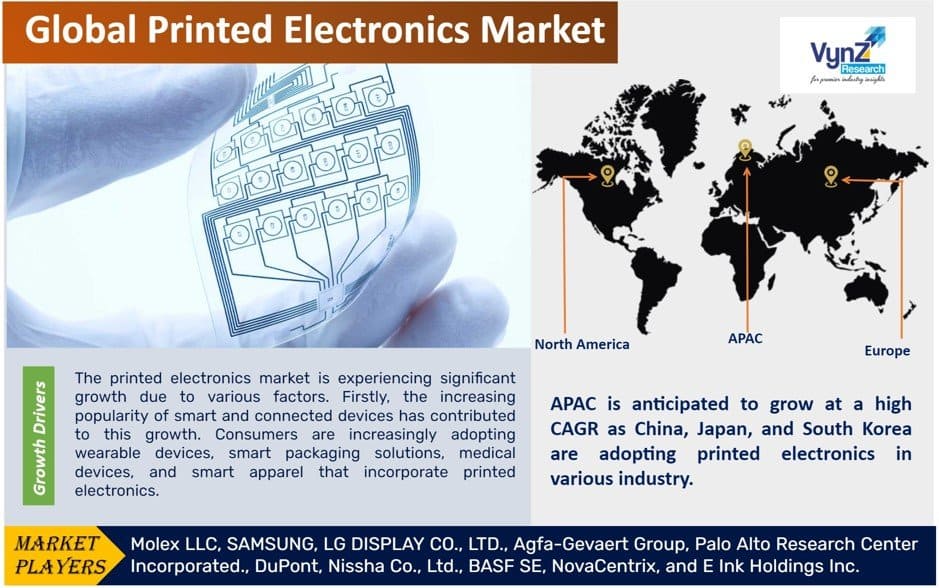
The primary growth factor of the global printed electronics market is the growing popularity of smart connected devices. Consumers today prefer smart packaging solutions, wearable and medical devices, and smart apparel, all of which incorporate printed electronics, thereby promoting its growth. The benefits gained in the form of higher adaptability and lightweight design push the market forward as do the innovations in this field. Advanced technologies in screen printing and additive production process along with the growing usage of printed panels and sensors in navigation systems in different vehicles promote market growth. These are also extremely useful for a wide range of automotive applications, which promotes the overall growth of the printed electronics market.
The significant challenges to the growth of the global printed electronics market include high installation costs and a lack of awareness regarding development of inks and substrates to enhance the performance of printed electronics. It is also attributed to the commercialization of novel and cost-effective inks.
The 3D manufacturing process and the adoption of novel applications present growth opportunities. There is also a huge amount of money invested in R&D by the market players to improve their functionalities and higher integration into several products, which also offers notable growth opportunities.
The APAC market is expected to grow more during the forecast period due to a higher concentration of industries, their development, and increased activities in developing countries like China, Japan, and South Korea that need to use printed electronics. The rise in demand for electronic gadgets such as mobile phones and tablets, along with wearable devices like AR headsets and fitness trackers, propel market growth in this region.
The manufacturers are adopting technology into different products based on the requirement and supply it to the retailers or distributors for sales. The industry players are entering into various strategies like M&A, partnerships, and product launches, and focusing on R&D activities to enhance printing capabilities and establish an edge against the competitors.
PARC is one of the leading innovators in printed electronics and has experience in electronics and provides new and current printing technology according to industrial specifications. They are developing printing multi-material 3D objects with electronic and mechanical functionality.
Molex is one of the leading providers of connectors and interconnect components. Molex offers a wide range of innovative PE designs to develop customer programs from concept to commercialization, aiding customers to fulfill their design dreams. Molex is one of the market leaders in three industrial areas: fine-line printing, large-format printing, and high-speed and roll-to-roll printing.
Some of the industry players in the printed electronics market include Molex LLC, SAMSUNG, LG DISPLAY CO., LTD., Agfa-Gevaert Group, Palo Alto Research Center Incorporated., DuPont, Nissha Co., Ltd., BASF SE, NovaCentrix, and E Ink Holdings Inc.
Molex has opened a new 23,000-square-meter facility in Poland for expanding its medical device output for Philips-Medisize.
Agfa and EFI have entered into a collaboration to leverage each other's cutting edge technologies.
The Printed Electronics Market report offers a comprehensive market segmentation analysis along with an estimation for the forecast period 2025–2030.
Segments Covered in the Report
Region Covered in the Report
Source: VynZ Research
1. Research Overview
1.1. The Report Offers
1.2. Market Coverage
1.2.1. By Material
1.2.2. By Printing Technology
1.2.3. By Resolution
1.2.4. By Application
1.2.5. By End-User
1.2.6. By Region
1.3. Research Phases
1.4. Limitations
1.5. Market Methodology
1.5.1. Data Sources
1.5.1.1. Primary Research
1.5.1.2. Secondary Research
1.5.2. Methodology
1.5.2.1. Data Exploration
1.5.2.2. Forecast Parameters
1.5.2.3. Data Validation
1.5.2.4. Assumptions
1.5.3. Study Period & Data Reporting Unit
2. Executive Summary
3. Industry Overview
3.1. Industry Dynamics
3.1.1. Market Growth Drivers
3.1.2. Market Restraints
3.1.3. Key Market Trends
3.1.4. Major Opportunities
3.2. Industry Ecosystem
3.2.1. Porter’s Five Forces Analysis
3.2.2. Recent Development Analysis
3.2.3. Value Chain Analysis
3.3. Competitive Insight
3.3.1. Competitive Position of Industry Players
3.3.2. Market Attractive Analysis
3.3.3. Market Share Analysis
4. Global Market Estimate and Forecast
4.1. Global Market Overview
4.2. Global Market Estimate and Forecast to 2030
5. Market Segmentation Estimate and Forecast
5.1. By Material
5.1.1. Inks
5.1.1.1. Market Definition
5.1.1.2. Market Estimation and Forecast to 2030
5.1.2. Substrates
5.1.2.1. Market Definition
5.1.2.2. Market Estimation and Forecast to 2030
5.2. By Printing Technology
5.2.1. Inkjet Printing
5.2.1.1. Market Definition
5.2.1.2. Market Estimation and Forecast to 2030
5.2.2. Screen Printing
5.2.2.1. Market Definition
5.2.2.2. Market Estimation and Forecast to 2030
5.2.3. Flexographic Printing
5.2.3.1. Market Definition
5.2.3.2. Market Estimation and Forecast to 2030
5.2.4. Gravure Printing
5.2.4.1. Market Definition
5.2.4.2. Market Estimation and Forecast to 2030
5.2.5. Others
5.2.5.1. Market Definition
5.2.5.2. Market Estimation and Forecast to 2030
5.3. By Resolution
5.3.1. Below 100 Lines/cm
5.3.1.1. Market Definition
5.3.1.2. Market Estimation and Forecast to 2030
5.3.2. 100 To 200 Lines/cm
5.3.2.1. Market Definition
5.3.2.2. Market Estimation and Forecast to 2030
5.3.3. Above 200 Lines/cm
5.3.3.1. Market Definition
5.3.3.2. Market Estimation and Forecast to 2030
5.4. By Application
5.4.1. Displays
5.4.1.1. Market Definition
5.4.1.2. Market Estimation and Forecast to 2030
5.4.2. RFID Tags
5.4.2.1. Market Definition
5.4.2.2. Market Estimation and Forecast to 2030
5.4.3. Batteries
5.4.3.1. Market Definition
5.4.3.2. Market Estimation and Forecast to 2030
5.4.4. Transportation
5.4.4.1. Market Definition
5.4.4.2. Market Estimation and Forecast to 2030
5.4.5. Photovoltaic Cells
5.4.5.1. Market Definition
5.4.5.2. Market Estimation and Forecast to 2030
5.4.6. Lighting
5.4.6.1. Market Definition
5.4.6.2. Market Estimation and Forecast to 2030
5.5. By End-User
5.5.1. Automotive and Transportation
5.5.1.1. Market Definition
5.5.1.2. Market Estimation and Forecast to 2030
5.5.2. Healthcare
5.5.2.1. Market Definition
5.5.2.2. Market Estimation and Forecast to 2030
5.5.3. Consumer Electronics
5.5.3.1. Market Definition
5.5.3.2. Market Estimation and Forecast to 2030
5.5.4. Aerospace and Defense
5.5.4.1. Market Definition
5.5.4.2. Market Estimation and Forecast to 2030
5.5.5. Construction and Architecture
5.5.5.1. Market Definition
5.5.5.2. Market Estimation and Forecast to 2030
5.5.6. Retail and Packaging
5.5.6.1. Market Definition
5.5.6.2. Market Estimation and Forecast to 2030
5.5.7. Others
5.5.7.1. Market Definition
5.5.7.2. Market Estimation and Forecast to 2030
6. North America Market Estimate and Forecast
6.1. By Material
6.2. By Printing Technology
6.3. By Resolution
6.4. By Resolution
6.5. By End-User
6.6. By Country – U.S., Canada, and Mexico
6.5.1. U.S. Market Estimate and Forecast
6.5.2. Canada Market Estimate and Forecast
6.5.3. Mexico Market Estimate and Forecast
7. Europe Market Estimate and Forecast
7.1. By Material
7.2. By Printing Technology
7.3. By Resolution
7.4. By Resolution
7.5. By End-User
7.6. By Country – Germany, U.K., France, Italy, Spain, Russia, and Rest of Europe
7.5.1. Germany Market Estimate and Forecast
7.5.2. France Market Estimate and Forecast
7.5.3. U.K. Market Estimate and Forecast
7.5.4. Italy Market Estimate and Forecast
7.5.5. Spain Market Estimate and Forecast
7.5.6. Rest of Europe Market Estimate and Forecast
8. Asia-Pacific Market Estimate and Forecast
8.1. By Material
8.2. By Printing Technology
8.3. By Resolution
8.4. By Resolution
8.5. By End-User
8.6. By Country – China, Japan, India, South Korea, and Rest of Asia-Pacific
8.5.1. China Market Estimate and Forecast
8.5.2. Japan Market Estimate and Forecast
8.5.3. India Market Estimate and Forecast
8.5.4. South Korea Market Estimate and Forecast
8.5.5. Singapore Market Estimate and Forecast
8.5.6. Rest of Asia-Pacific Market Estimate and Forecast
9. Rest of the World (RoW) Market Estimate and Forecast
9.1. By Material
9.2. By Printing Technology
9.3. By Resolution
9.4. By Resolution
9.5. By End-User
9.6. By Country – Brazil, Saudi Arabia, South Africa, U.A.E., and Other Countries
9.5.1. Brazil Market Estimate and Forecast
9.5.2. Saudi Arabia Market Estimate and Forecast
9.5.3. South Africa Market Estimate and Forecast
9.5.4. Other Countries Market Estimate and Forecast
10. Company Profiles
10.1. Molex LLC
10.1.1. Snapshot
10.1.2. Overview
10.1.3. Offerings
10.1.4. Financial Insight
10.1.5. Recent Developments
10.2. SAMSUNG
10.2.1. Snapshot
10.2.2. Overview
10.2.3. Offerings
10.2.4. Financial Insight
10.2.5. Recent Developments
10.3. LG DISPLAY CO., LTD.
10.3.1. Snapshot
10.3.2. Overview
10.3.3. Offerings
10.3.4. Financial Insight
10.3.5. Recent Developments
10.4. Agfa-Gevaert Group
10.4.1. Snapshot
10.4.2. Overview
10.4.3. Offerings
10.4.4. Financial Insight
10.4.5. Recent Developments
10.5. Palo Alto Research Center Incorporated.
10.5.1. Snapshot
10.5.2. Overview
10.5.3. Offerings
10.5.4. Financial Insight
10.5.5. Recent Developments
10.6. DuPont
10.6.1. Snapshot
10.6.2. Overview
10.6.3. Offerings
10.6.4. Financial Insight
10.6.5. Recent Developments
10.7. Nissha Co., Ltd.
10.7.1. Snapshot
10.7.2. Overview
10.7.3. Offerings
10.7.4. Financial Insight
10.7.5. Recent Developments
10.8. BASF SE
10.8.1. Snapshot
10.8.2. Overview
10.8.3. Offerings
10.8.4. Financial Insight
10.8.5. Recent Developments
10.9. NovaCentrix
10.9.1. Snapshot
10.9.2. Overview
10.9.3. Offerings
10.9.4. Financial Insight
10.9.5. Recent Developments
10.10. E Ink Holdings Inc.
10.10.1. Snapshot
10.10.2. Overview
10.10.3. Offerings
10.10.4. Financial Insight
10.10.5. Recent Developments
11. Appendix
11.1. Exchange Rates
11.2. Abbreviations
Note: Financial insight and recent developments of different companies are subject to the availability of information in the secondary domain.
List of Tables
Table 1 Sources
Table 2 Study Periods
Table 3 Data Reporting Unit
Table 4 Global Printed Electronics Market, By Material, 2018 - 2023 (USD Billion)
Table 5 Global Printed Electronics Market, By Material, 2025 - 2030 (USD Billion)
Table 6 Global Printed Electronics Market, By Printing Technology, 2018 - 2023 (USD Billion)
Table 7 Global Printed Electronics Market, By Printing Technology, 2025 - 2030 (USD Billion)
Table 8 Global Printed Electronics Market, By Resolution, 2018 - 2023 (USD Billion)
Table 10 Global Printed Electronics Market, By Resolution, 2025 - 2030 (USD Billion)
Table 11 Global Printed Electronics Market, By Application, 2018 - 2023 (USD Billion)
Table 12 Global Printed Electronics Market, By Application, 2025 - 2030 (USD Billion)
Table 13 Global Printed Electronics Market, By End-User, 2018 - 2023 (USD Billion)
Table 14 Global Printed Electronics Market, By End-User, 2025 - 2030 (USD Billion)
Table 15 Global Printed Electronics Market, By Region, 2018 - 2023 (USD Billion)
Table 16 Global Printed Electronics Market, By Region, 2025 - 2030 (USD Billion)
Table 17 North America Printed Electronics Market, By Material, 2018 - 2023 (USD Billion)
Table 18 North America Printed Electronics Market, By Material, 2025 - 2030 (USD Billion)
Table 19 North America Printed Electronics Market, By Printing Technology, 2018 - 2023 (USD Billion)
Table 20 North America Printed Electronics Market, By Printing Technology, 2025 - 2030 (USD Billion)
Table 21 North America Printed Electronics Market, By Resolution, 2018 - 2023 (USD Billion)
Table 22 North America Printed Electronics Market, By Resolution, 2025 - 2030 (USD Billion)
Table 23 North America Printed Electronics Market, By Application, 2018 - 2023 (USD Billion)
Table 24 North America Printed Electronics Market, By Application, 2025 - 2030 (USD Billion)
Table 25 North America Printed Electronics Market, By End-User, 2018 - 2023 (USD Billion)
Table 26 North America Printed Electronics Market, By End-User, 2025 - 2030 (USD Billion)
Table 27 North America Printed Electronics Market, By Region, 2018 - 2023 (USD Billion)
Table 28 North America Printed Electronics Market, By Region, 2025 - 2030 (USD Billion)
Table 29 Europe Printed Electronics Market, By Material, 2018 - 2023 (USD Billion)
Table 30 Europe Printed Electronics Market, By Material, 2025 - 2030 (USD Billion)
Table 31 Europe Printed Electronics Market, By Printing Technology, 2018 - 2023 (USD Billion)
Table 32 Europe Printed Electronics Market, By Printing Technology, 2025 - 2030 (USD Billion)
Table 33 Europe Printed Electronics Market, By Resolution, 2018 - 2023 (USD Billion)
Table 34 Europe Printed Electronics Market, By Resolution, 2025 - 2030 (USD Billion)
Table 35 Europe Printed Electronics Market, By Application, 2018 - 2023 (USD Billion)
Table 36 Europe Printed Electronics Market, By Application, 2025 - 2030 (USD Billion)
Table 37 Europe Printed Electronics Market, By End-User, 2018 - 2023 (USD Billion)
Table 38 Europe Printed Electronics Market, By End-User, 2025 - 2030 (USD Billion)
Table 39 Europe Printed Electronics Market, By Region, 2018 - 2023 (USD Billion)
Table 40 Europe Printed Electronics Market, By Region, 2025 - 2030 (USD Billion)
Table 41 Asia-Pacific Printed Electronics Market, By Material, 2018 - 2023 (USD Billion)
Table 42 Asia-Pacific Printed Electronics Market, By Material, 2025 - 2030 (USD Billion)
Table 43 Asia-Pacific Printed Electronics Market, By Printing Technology, 2018 - 2023 (USD Billion)
Table 44 Asia-Pacific Printed Electronics Market, By Printing Technology, 2025 - 2030 (USD Billion)
Table 45 Asia-Pacific Printed Electronics Market, By Resolution, 2018 - 2023 (USD Billion)
Table 46 Asia-Pacific Printed Electronics Market, By Resolution, 2025 - 2030 (USD Billion)
Table 47 Asia-Pacific Printed Electronics Market, By Application, 2018 - 2023 (USD Billion)
Table 48 Asia-Pacific Printed Electronics Market, By Application, 2025 - 2030 (USD Billion)
Table 49 Asia-Pacific Printed Electronics Market, By End-User, 2018 - 2023 (USD Billion)
Table 50 Asia-Pacific Printed Electronics Market, By End-User, 2025 - 2030 (USD Billion)
Table 51 Asia-Pacific Printed Electronics Market, By Region, 2018 - 2023 (USD Billion)
Table 52 Asia-Pacific Printed Electronics Market, By Region, 2025 - 2030 (USD Billion)
Table 53 RoW Printed Electronics Market, By Material, 2018 - 2023 (USD Billion)
Table 54 RoW Printed Electronics Market, By Material, 2025 - 2030 (USD Billion)
Table 55 RoW Printed Electronics Market, By Printing Technology, 2018 - 2023 (USD Billion)
Table 56 RoW Printed Electronics Market, By Printing Technology, 2025 - 2030 (USD Billion)
Table 57 RoW Printed Electronics Market, By Resolution, 2018 - 2023 (USD Billion)
Table 58 RoW Printed Electronics Market, By Resolution, 2025 - 2030 (USD Billion)
Table 59 RoW Printed Electronics Market, By Application, 2018 - 2023 (USD Billion)
Table 60 RoW Printed Electronics Market, By Application, 2025 - 2030 (USD Billion)
Table 61 RoW Printed Electronics Market, By End-User, 2018 - 2023 (USD Billion)
Table 62 RoW Printed Electronics Market, By End-User, 2025 - 2030 (USD Billion)
Table 63 RoW Printed Electronics Market, By Region, 2018 - 2023 (USD Billion)
Table 64 RoW Printed Electronics Market, By Region, 2025 - 2030 (USD Billion)
Table 65 Snapshot – Molex LLC
Table 66 Snapshot – SAMSUNG
Table 67 Snapshot – LG DISPLAY CO., LTD.
Table 68 Snapshot – Agfa-Gevaert Group
Table 69 Snapshot – Palo Alto Research Center Incorporated.
Table 70 Snapshot – DuPont
Table 71 Snapshot – Nissha Co., Ltd.
Table 72 Snapshot – BASF SE
Table 73 Snapshot – NovaCentrix
Table 74 Snapshot – E Ink Holdings Inc.
List of Figures
Figure 1 Market Coverage
Figure 2 Research Phases
Figure 3 Secondary Sources for Different Parameters
Figure 4 Methodology
Figure 5 Data Mining & Exploration
Figure 6 Data Triangulation
Figure 7 Assumptions for Market Estimation and Forecast
Figure 8 Market Synopsis
Figure 9 Global Printed Electronics Market- Growth Drivers and Restraints
Figure 10 Competitive Benchmark
Figure 11 Global Printed Electronics Market Highlight
Figure 12 Global Printed Electronics Market, By Material, 2018 - 2030 (USD Billion)
Figure 13 Global Printed Electronics Market, By Printing Printing Technology, 2018 - 2030 (USD Billion)
Figure 14 Global Printed Electronics Market, By Resolution, 2018 - 2030 (USD Billion)
Figure 15 Global Printed Electronics Market, By Application, 2018 - 2030 (USD Billion)
Figure 16 Global Printed Electronics Market, By End-User, 2018 - 2030 (USD Billion)
Figure 17 Global Printed Electronics Market, By Region, 2018 - 2030 (USD Billion)
Figure 18 North America Printed Electronics Market Highlight
Figure 19 North America Printed Electronics Market, By Material, 2018 - 2030 (USD Billion)
Figure 20 North America Printed Electronics Market, By Printing Printing Technology, 2018 - 2030 (USD Billion)
Figure 21 North America Printed Electronics Market, By Resolution, 2018 - 2030 (USD Billion)
Figure 22 North America Printed Electronics Market, By Application, 2018 - 2030 (USD Billion)
Figure 23 North America Printed Electronics Market, By End-User, 2018 - 2030 (USD Billion)
Figure 24 North America Printed Electronics Market, By Region, 2018 - 2030 (USD Billion)
Figure 25 Europe Printed Electronics Market Highlight
Figure 26 Europe Printed Electronics Market, By Material, 2018 - 2030 (USD Billion)
Figure 27 Europe Printed Electronics Market, By Printing Technology, 2018 - 2030 (USD Billion)
Figure 28 Europe Printed Electronics Market, By Resolution, 2018 - 2030 (USD Billion)
Figure 29 Europe Printed Electronics Market, By Application, 2018 - 2030 (USD Billion)
Figure 30 Europe Printed Electronics Market, By End-User, 2018 - 2030 (USD Billion)
Figure 31 Europe Printed Electronics Market, By Region, 2018 - 2030 (USD Billion)
Figure 32 Asia-Pacific Printed Electronics Market Highlight
Figure 33 Asia-Pacific Printed Electronics Market, By Material, 2018 - 2030 (USD Billion)
Figure 34 Asia-Pacific Printed Electronics Market, By Printing Technology, 2018 - 2030 (USD Billion)
Figure 35 Asia-Pacific Printed Electronics Market, By Resolution, 2018 - 2030 (USD Billion)
Figure 36 Asia-Pacific Printed Electronics Market, By Application, 2018 - 2030 (USD Billion)
Figure 37 Asia-Pacific Printed Electronics Market, By End-User, 2018 - 2030 (USD Billion)
Figure 38 Asia-Pacific Printed Electronics Market, By Region, 2018 - 2030 (USD Billion)
Figure 39 RoW Printed Electronics Market Highlight
Figure 40 RoW Printed Electronics Market, By Material, 2018 - 2030 (USD Billion)
Figure 41 RoW Printed Electronics Market, By Printing Technology, 2018 - 2030 (USD Billion)
Figure 42 RoW Printed Electronics Market, By Resolution, 2018 - 2030 (USD Billion)
Figure 43 RoW Printed Electronics Market, By Application, 2018 - 2030 (USD Billion)
Figure 44 RoW Printed Electronics Market, By End-User, 2018 - 2030 (USD Billion)
Figure 45 RoW Printed Electronics Market, By Region, 2018 - 2030 (USD Billion)
Global Printed Electronics Market Coverage
Material Insight and Forecast 2025-2030
Printing Technology Insight and Forecast 2025-2030
Resolution Insight and Forecast 2015-2027
Application Insight and Forecast 2025-2030
End-User Insight and Forecast 2025-2030
Geographical Segmentation
Printed Electronics Market by Region
North America
Europe
Asia-Pacific (APAC)
Rest of the World (RoW)
Vynz Research know in your business needs, you required specific answers pertaining to the market, Hence, our experts and analyst can provide you the customized research support on your specific needs.
After the purchase of current report, you can claim certain degree of free customization within the scope of the research.
Please let us know, how we can serve you better with your specific requirements to your research needs. Vynz research promises for quick reversal for your current business requirements.
Purchase Options
Latest Report
Research Methodology
Connect With Our Sales Team