- 1-888-253-3960
- enquiry@vynzresearch.com
-
This is lorem ipsum doller
Process Automation and Instrumentation Market
| Status : Published | Published On : Jan, 2024 | Report Code : VRSME9094 | Industry : Semiconductor & Electronics | Available Format :

|
Page : 250 |
Global Process Automation and Instrumentation Market – Analysis and Forecast (2025-2030)
Industry Insight by Instrument (Field Instrument, Control Valve, and Analytical Instrument), by Solution (PLC, DCS, SCADA, HMI, Safety Automation, APC, and MES), by Industry Vertical (Food & Beverages, Pharmaceuticals, Chemicals, Energy & Power, Oil & Gas, Metals & Mining, Water & Wastewater, Pulp & Paper, and Others), and Geography (U.S., Canada, Germany, U.K., France, China, Japan, India, and Rest of the World)
Industry Overview
The Global Process Automation And Instrumentation Market is projected to experience substantial growth in the coming years. Starting from a value of USD 70 billion in 2023, the market is expected to reach a staggering USD 82.6 billion by 2030. This growth trajectory indicates a Compound Annual Growth Rate (CAGR) of 2.7% during the forecast period spanning from 2025 to 2030.
Process automation and instrumentation is a method of monitoring and controlling various business production processes. It is the technology-enabled automation and instrumentation of complex business processes that assist in streamlining operations, meeting organizational goals, improving quality, and lowering operating costs. The technology also entails using numerous interrelated processes to monitor and control physical quantities. The key drivers of process automation and instrumentation market development are mounting concerns about planned functional safety and protection, increasing demand for energy-efficient manufacturing processes, rising labor expenses, and high productivity levels with low prices.
The COVID-19 pandemic has led to huge losses to manufacturers globally. Process automation and instrumentation are serving industries like oil and gas, chemical, and power generation industries. These industries have cut back on their production services for the time being owing to reduced demand and supply chain disruption. As a result, demand for process automation and instrumentation has decreased, which is having a snowball impact on the market. However, the steps taken in fiscal policy by regional financial institutions to help manufacturing facilities float during the COVID-19 pandemic will drive the growth in the process automation and instrumentation market.
Process Automation and Instrumentation Market Segmentation
Insight by Instrument
The global process automation and instrumentation market is classified into three categories based on instrument, namely, field instrument, control valve, and analytical instrument segments. Out of these, the field instrument segment dominates the market due to its significant role in process control and ability to monitor and measure critical factors like temperature, pressure, level, and flow in processing industries such as oil & gas, mining, chemicals, and pharmaceuticals. These instruments can be automated and operated from the control room and help in easy and speedy information transfer in a secure and precise manner.
Insight by Solution
The global process automation and instrumentation market is divided into different solutions into PLC, DCS, SCADA, HMI, safety automation, APC, and MES segments. Out of these segments, the HMI segment is expected to grow at a higher CAGR during the forecast period due to better integration with specialized computers, the ability to extract useful and actionable data by the operators from plant equipment, the ability to process and display data received from other connected systems, improving productivity, enhancing operator safety, reducing human involvement and errors in the production process. On the other hand, the MES segment is also expected to grow at a higher CAGR due to its ability to improve productivity, reduce cycle times, and eliminate human dependency in data processing. It also offers operational cost-effective opportunities and improves supply chain production asset production.
Insight by Industry Vertical
According to the different industry verticals, the global process automation and instrumentation market is divided into food & beverages, pharmaceuticals, chemicals, energy & power, oil & gas, metals & mining, water & wastewater, pulp & paper, and other segments. Out of all these segments, the pharmaceutical industry is expected to grow at a faster rate during the forecast period due to its growing need for precision measuring equipment to ensure accurate dosage of medicine, increasing requirement for process automation solutions across different processes like drug development, manufacturing, testing, packaging, and distribution. The energy & power sector will also grow due to the rise in demand for electricity, clean and smart energy, the need to overcome power generation and distribution losses, and increased deployment in the value chain of the oil & gas industry.
Global Process Automation and Instrumentation Market Report Coverage
|
Report Metric |
Details |
|
Historical Period |
2018 - 2023 |
|
Base Year Considered |
2024 |
|
Forecast Period |
2025 - 2030 |
|
Market Size in 2024 |
U.S.D. 70 Billion |
|
Revenue Forecast in 2030 |
U.S.D. 82.6 Billion |
|
Growth Rate |
2.7% |
|
Segments Covered in the Report |
By Instrument, By Solution, and By Industry Vertical |
|
Report Scope |
Market Trends, Drivers, and Restraints; Revenue Estimation and Forecast; Segmentation Analysis; Impact of COVID-19; Companies’ Strategic Developments; Market Share Analysis of Key Players; Company Profiling |
|
Regions Covered in the Report |
North America, Europe, Asia-Pacific, Middle East, and Rest of the World |
Industry Dynamics
Process Automation and Instrumentation Industry Trends
The higher adoption of Industry 4.0 practices is a significant trend that results in smart automation in the manufacturing sectors, offering benefits like improved production, team performance, and quality of products, along with reduced cost and errors. The rise in demand for process optimization in industrial operations to reduce time is another significant trend, along with the growing initiatives by the government to adopt automation.
Process Automation and Instrumentation Market Growth Drivers
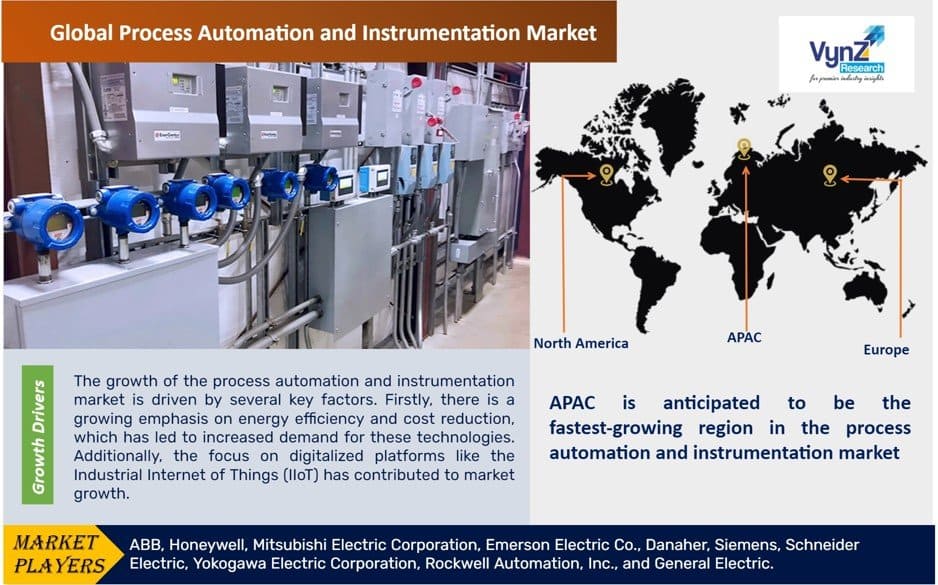
The growth of the global process automation and instrumentation market is influenced by the growing emphasis on energy efficiency and cost reduction by several industries. The rise in demand for this technology due to the growing focus on digitalized platforms like the Industrial Internet of Things (IIoT) also contributes to the market growth. Another significant growth factor is the higher adoption of industrial automation across industries, along with the need to implement stringent compliances and regulations to improve production. Furthermore, the need for resource optimization, increased investment in R&D activities by the automotive industry, constant advancements of manufacturing units in the utility and oil & gas sectors, the need for proactive solutions to administer component failures more effectively, and the increased adoption of multivendor portable applications are promoting further market growth.
Process Automation and Instrumentation Market Challenges
The high initial investment, operational, and maintenance cost of solutions like MES and devices like process analyzers, control valves, and transmitters restrain the market growth along with the reduction in demand and supply of products, limited penetration by SMEs due to budget restrictions also hinders market growth.
Process Automation and Instrumentation Market Opportunities
Growth opportunities are offered by the growing demand for safety automation solutions to prevent thefts, accidents, terrorist attacks, and equipment malfunctioning since this practice can handle complex processes during emergencies.
Process Automation and Instrumentation Market Geographic Overview
The APAC market is expected to grow at a higher CAGR during the forecast period due to a robust infrastructure and further investments in its development, especially in the energy & power sector. This is attributed mainly to the growing demand for electricity, power reliability, production of oil & gas, and food & beverage due to the growing population, rapid industrialization, continual growth in industrial activities, and supportive government policies.
Process Automation and Instrumentation Market Competitive Insight
Process automation and instrumentation are moderately fragmented with many players entering into partnerships, acquisitions, product launches, and R&D activities to have a competitive edge in the market.
Mitsubishi Electric is focused on technological innovation and ceaseless creativity and its process automation solutions are aiding customers to visualize and optimize their operations. Mitsubishi Electric combines the power of process automation and digital data to provide cutting-edge solutions to organizations.
ABB is one of the leading global technology companies that is engaged in power automation technologies and is focused on transforming society to achieve a more productive sustainable future. Process Automation business provides a variety of solutions for process and hybrid industries, including industry-specific integrated automation, electrification, and digital solutions, control technologies, software, and advanced services, as well as measurement & analytics, marine, and turbocharging.
Some of the leading players in the process automation and implementation industry include ABB, Honeywell, Mitsubishi Electric Corporation, Emerson Electric Co., Danaher, Siemens, Schneider Electric, Yokogawa Electric Corporation, Rockwell Automation, Inc., and General Electric.
Recent Developments by Key Players
Mitsubishi Electric Corporation has signed a pilot contract with Raytheon to repair transmitters used in APG-63 (V)1 F-15 fighter radars operated by the US Air Force and allied forces.
Emerson Electric Co (U.S. industrial conglomerate) bought National Instruments Corp for USD 8.2 billion, capping a nearly yearlong pursuit of the measurement equipment maker.
The Process Automation and Instrumentation Market report offers a comprehensive market segmentation analysis along with an estimation for the forecast period 2025–2030.
Segments Covered in the Report
- By Instrument
- Field Instrument
- Control Valve
- Analytical Instrument
- By Solution
- PLC
- DCS
- SCADA
- HMI
- Safety Automation
- APC
- MES
- By Industry Vertical
- Food & Beverages
- Pharmaceuticals
- Chemicals
- Energy & Power
- Oil & Gas
- Metals & Mining
- Water & Wastewater
- Pulp & Paper
- Others
Region Covered in the Report
- North America
- U.S.
- Canada
- Mexico
- Europe
- Germany
- U.K.
- France
- Italy
- Spain
- Russia
- Rest of Europe
- Asia-Pacific (APAC)
- China
- Japan
- India
- South Korea
- Rest of Asia-Pacific
- Rest of the World (RoW)
- Brazil
- Saudi Arabia
- South Africa
- U.A.E.
- Other Countries
.png "Process Automation and Instrumentation Market Size and Market Analysis")
1. Research Overview
1.1. The Report Offers
1.2. Market Coverage
1.2.1. By Instrument
1.2.2. By Solution
1.2.3. By Industry Vertical
1.2.4. By Region
1.3. Research Phases
1.4. Limitations
1.5. Market Methodology
1.5.1. Data Sources
1.5.1.1. Primary Research
1.5.1.2. Secondary Research
1.5.2. Methodology
1.5.2.1. Data Exploration
1.5.2.2. Forecast Parameters
1.5.2.3. Data Validation
1.5.2.4. Assumptions
1.5.3. Study Period & Data Reporting Unit
2. Executive Summary
3. Industry Overview
3.1. Industry Dynamics
3.1.1. Market Growth Drivers
3.1.2. Market Restraints
3.1.3. Key Market Trends
3.1.4. Major Opportunities
3.2. Industry Ecosystem
3.2.1. Porter’s Five Forces Analysis
3.2.2. Recent Development Analysis
3.2.3. Value Chain Analysis
3.3. Competitive Insight
3.3.1. Competitive Position of Industry Players
3.3.2. Market Attractive Analysis
3.3.3. Market Share Analysis
4. Global Market Estimate and Forecast
4.1. Global Market Overview
4.2. Global Market Estimate and Forecast to 2030
5. Market Segmentation Estimate and Forecast
5.1. By Instrument
5.1.1. Field Instrument
5.1.1.1. Market Definition
5.1.1.2. Market Estimation and Forecast to 2030
5.1.2. Control Valve
5.1.2.1. Market Definition
5.1.2.2. Market Estimation and Forecast to 2030
5.1.3. Analytical Instrument
5.1.3.1. Market Definition
5.1.3.2. Market Estimation and Forecast to 2030
5.2. By Solution
5.2.1. PLC
5.2.1.1. Market Definition
5.2.1.2. Market Estimation and Forecast to 2030
5.2.2. DCS
5.2.2.1. Market Definition
5.2.2.2. Market Estimation and Forecast to 2030
5.2.3. SCADA
5.2.3.1. Market Definition
5.2.3.2. Market Estimation and Forecast to 2030
5.2.4. HMI
5.2.4.1. Market Definition
5.2.4.2. Market Estimation and Forecast to 2030
5.2.5. Safety Automation
5.2.5.1. Market Definition
5.2.5.2. Market Estimation and Forecast to 2030
5.2.6. APC
5.2.6.1. Market Definition
5.2.6.2. Market Estimation and Forecast to 2030
5.2.7. MES
5.2.7.1. Market Definition
5.2.7.2. Market Estimation and Forecast to 2030
5.3. By Industry Vertical
5.3.1. Food & Beverages
5.3.1.1. Market Definition
5.3.1.2. Market Estimation and Forecast to 2030
5.3.2. Pharmaceuticals
5.3.2.1. Market Definition
5.3.2.2. Market Estimation and Forecast to 2030
5.3.3. Chemicals
5.3.3.1. Market Definition
5.3.3.2. Market Estimation and Forecast to 2030
5.3.4. Energy & Power
5.3.4.1. Market Definition
5.3.4.2. Market Estimation and Forecast to 2030
5.3.5. Oil & Gas
5.3.5.1. Market Definition
5.3.5.2. Market Estimation and Forecast to 2030
5.3.6. Metals & Mining
5.3.6.1. Market Definition
5.3.6.2. Market Estimation and Forecast to 2030
5.3.7. Water & Wastewater
5.3.7.1. Market Definition
5.3.7.2. Market Estimation and Forecast to 2030
5.3.8. Pulp & Paper
5.3.8.1. Market Definition
5.3.8.2. Market Estimation and Forecast to 2030
5.3.9. Others
5.3.9.1. Market Definition
5.3.9.2. Market Estimation and Forecast to 2030
6. North America Market Estimate and Forecast
6.1. By Instrument
6.2. By Solution
6.3. By Industry Vertical
6.4. By Country – U.S., Canada, and Mexico
6.5.1. U.S. Market Estimate and Forecast
6.5.2. Canada Market Estimate and Forecast
6.5.3. Mexico Market Estimate and Forecast
7. Europe Market Estimate and Forecast
7.1. By Instrument
7.2. By Solution
7.3. By Industry Vertical
7.4. By Country – Germany, U.K., France, Italy, Spain, Russia, and Rest of Europe
7.5.1. Germany Market Estimate and Forecast
7.5.2. France Market Estimate and Forecast
7.5.3. U.K. Market Estimate and Forecast
7.5.4. Italy Market Estimate and Forecast
7.5.5. Spain Market Estimate and Forecast
7.5.6. Rest of Europe Market Estimate and Forecast
8. Asia-Pacific Market Estimate and Forecast
8.1. By Instrument
8.2. By Solution
8.3. By Industry Vertical
8.4. By Country – China, Japan, India, South Korea, and Rest of Asia-Pacific
8.5.1. China Market Estimate and Forecast
8.5.2. Japan Market Estimate and Forecast
8.5.3. India Market Estimate and Forecast
8.5.4. South Korea Market Estimate and Forecast
8.5.5. Singapore Market Estimate and Forecast
8.5.6. Rest of Asia-Pacific Market Estimate and Forecast
9. Rest of the World (RoW) Market Estimate and Forecast
9.1. By Instrument
9.2. By Solution
9.3. By Industry Vertical
9.4. By Country – Brazil, Saudi Arabia, South Africa, U.A.E., and Other Countries
9.5.1. Brazil Market Estimate and Forecast
9.5.2. Saudi Arabia Market Estimate and Forecast
9.5.3. South Africa Market Estimate and Forecast
9.5.4. Other Countries Market Estimate and Forecast
10. Company Profiles
10.1. ABB
10.1.1. Snapshot
10.1.2. Overview
10.1.3. Offerings
10.1.4. Financial Insight
10.1.5. Recent Developments
10.2. Honeywell
10.2.1. Snapshot
10.2.2. Overview
10.2.3. Offerings
10.2.4. Financial Insight
10.2.5. Recent Developments
10.3. Mitsubishi Electric Corporation
10.3.1. Snapshot
10.3.2. Overview
10.3.3. Offerings
10.3.4. Financial Insight
10.3.5. Recent Developments
10.4. Emerson Electric Co.
10.4.1. Snapshot
10.4.2. Overview
10.4.3. Offerings
10.4.4. Financial Insight
10.4.5. Recent Developments
10.5. Danaher
10.5.1. Snapshot
10.5.2. Overview
10.5.3. Offerings
10.5.4. Financial Insight
10.5.5. Recent Developments
10.6. Siemens
10.6.1. Snapshot
10.6.2. Overview
10.6.3. Offerings
10.6.4. Financial Insight
10.6.5. Recent Developments
10.7. Schneider Electric
10.7.1. Snapshot
10.7.2. Overview
10.7.3. Offerings
10.7.4. Financial Insight
10.7.5. Recent Developments
10.8. Yokogawa Electric Corporation
10.8.1. Snapshot
10.8.2. Overview
10.8.3. Offerings
10.8.4. Financial Insight
10.8.5. Recent Developments
10.9. Rockwell Automation, Inc.
10.9.1. Snapshot
10.9.2. Overview
10.9.3. Offerings
10.9.4. Financial Insight
10.9.5. Recent Developments
10.10. General Electric.
10.10.1. Snapshot
10.10.2. Overview
10.10.3. Offerings
10.10.4. Financial Insight
10.10.5. Recent Developments
11. Appendix
11.1. Exchange Rates
11.2. Abbreviations
Note: Financial insight and recent developments of different companies are subject to the availability of information in the secondary domain.
List of Tables
Table 1 Sources
Table 2 Study Periods
Table 3 Data Reporting Unit
Table 4 Global Process Automation and Instrumentation Market, By Instrument, 2018 - 2023 (USD Billion)
Table 5 Global Process Automation and Instrumentation Market, By Instrument, 2025 - 2030 (USD Billion)
Table 6 Global Process Automation and Instrumentation Market, By Solution, 2018 - 2023 (USD Billion)
Table 7 Global Process Automation and Instrumentation Market, By Solution, 2025 - 2030 (USD Billion)
Table 8 Global Process Automation and Instrumentation Market, By Industry Vertical, 2018 - 2023 (USD Billion)
Table 9 Global Process Automation and Instrumentation Market, By Industry Vertical, 2025 - 2030 (USD Billion)
Table 10 Global Process Automation and Instrumentation Market, By Region, 2018 - 2023 (USD Billion)
Table 11 Global Process Automation and Instrumentation Market, By Region, 2025 - 2030 (USD Billion)
Table 12 North America Process Automation and Instrumentation Market, By Instrument, 2018 - 2023 (USD Billion)
Table 13 North America Process Automation and Instrumentation Market, By Instrument, 2025 - 2030 (USD Billion)
Table 14 North America Process Automation and Instrumentation Market, By Solution, 2018 - 2023 (USD Billion)
Table 15 North America Process Automation and Instrumentation Market, By Solution, 2025 - 2030 (USD Billion)
Table 16 North America Process Automation and Instrumentation Market, By Industry Vertical, 2018 - 2023 (USD Billion)
Table 17 North America Process Automation and Instrumentation Market, By Industry Vertical, 2025 - 2030 (USD Billion)
Table 18 North America Process Automation and Instrumentation Market, By Region, 2018 - 2023 (USD Billion)
Table 19 North America Process Automation and Instrumentation Market, By Region, 2025 - 2030 (USD Billion)
Table 20 Europe Process Automation and Instrumentation Market, By Instrument, 2018 - 2023 (USD Billion)
Table 21 Europe Process Automation and Instrumentation Market, By Instrument, 2025 - 2030 (USD Billion)
Table 22 Europe Process Automation and Instrumentation Market, By Solution, 2018 - 2023 (USD Billion)
Table 23 Europe Process Automation and Instrumentation Market, By Solution, 2025 - 2030 (USD Billion)
Table 24 Europe Process Automation and Instrumentation Market, By Industry Vertical, 2018 - 2023 (USD Billion)
Table 25 Europe Process Automation and Instrumentation Market, By Industry Vertical, 2025 - 2030 (USD Billion)
Table 26 Europe Process Automation and Instrumentation Market, By Region, 2018 - 2023 (USD Billion)
Table 27 Europe Process Automation and Instrumentation Market, By Region, 2025 - 2030 (USD Billion)
Table 28 Asia-Pacific Process Automation and Instrumentation Market, By Instrument, 2018 - 2023 (USD Billion)
Table 29 Asia-Pacific Process Automation and Instrumentation Market, By Instrument, 2025 - 2030 (USD Billion)
Table 30 Asia-Pacific Process Automation and Instrumentation Market, By Solution, 2018 - 2023 (USD Billion)
Table 31 Asia-Pacific Process Automation and Instrumentation Market, By Solution, 2025 - 2030 (USD Billion)
Table 32 Asia-Pacific Process Automation and Instrumentation Market, By Industry Vertical, 2018 - 2023 (USD Billion)
Table 33 Asia-Pacific Process Automation and Instrumentation Market, By Industry Vertical, 2025 - 2030 (USD Billion)
Table 34 Asia-Pacific Process Automation and Instrumentation Market, By Region, 2018 - 2023 (USD Billion)
Table 35 Asia-Pacific Process Automation and Instrumentation Market, By Region, 2025 - 2030 (USD Billion)
Table 36 RoW Process Automation and Instrumentation Market, By Instrument, 2018 - 2023 (USD Billion)
Table 37 RoW Process Automation and Instrumentation Market, By Instrument, 2025 - 2030 (USD Billion)
Table 38 RoW Process Automation and Instrumentation Market, By Solution, 2018 - 2023 (USD Billion)
Table 39 RoW Process Automation and Instrumentation Market, By Solution, 2025 - 2030 (USD Billion)
Table 40 RoW Process Automation and Instrumentation Market, By Industry Vertical, 2018 - 2023 (USD Billion)
Table 41 RoW Process Automation and Instrumentation Market, By Industry Vertical, 2025 - 2030 (USD Billion)
Table 42 RoW Process Automation and Instrumentation Market, By Region, 2018 - 2023 (USD Billion)
Table 43 RoW Process Automation and Instrumentation Market, By Region, 2025 - 2030 (USD Billion)
Table 44 Snapshot – ABB
Table 45 Snapshot – Honeywell
Table 46 Snapshot – Mitsubishi Electric Corporation
Table 47 Snapshot – Emerson Electric Co.
Table 48 Snapshot – Danaher
Table 49 Snapshot – Siemens
Table 50 Snapshot – Schneider Electric
Table 51 Snapshot – Yokogawa Electric Corporation
Table 52 Snapshot – Rockwell Automation, Inc.
Table 53 Snapshot – General Electric.
List of Figures
Figure 1 Market Coverage
Figure 2 Research Phases
Figure 3 Secondary Sources for Different Parameters
Figure 4 Methodology
Figure 5 Data Mining & Exploration
Figure 6 Data Triangulation
Figure 7 Assumptions for Market Estimation and Forecast
Figure 8 Market Synopsis
Figure 9 Global Process Automation and Instrumentation Market- Growth Drivers and Restraints
Figure 10 Competitive Benchmark
Figure 11 Global Process Automation and Instrumentation Market, Highlight
Figure 12 Global Process Automation and Instrumentation Market, By Instrument, 2018 - 2030 (USD Billion)
Figure 13 Global Process Automation and Instrumentation Market, By Solution, 2018 - 2030 (USD Billion)
Figure 14 Global Process Automation and Instrumentation Market, By Industry Vertical, 2018 - 2030 (USD Billion)
Figure 15 Global Process Automation and Instrumentation Market, By Region, 2018 - 2030 (USD Billion)
Figure 16 North America Process Automation and Instrumentation Market Highlight
Figure 17 North America Process Automation and Instrumentation Market, By Instrument, 2018 - 2030 (USD Billion)
Figure 18 North America Process Automation and Instrumentation Market, By Solution, 2018 - 2030 (USD Billion)
Figure 19 North America Process Automation and Instrumentation Market, By Industry Vertical, 2018 - 2030 (USD Billion)
Figure 20 North America Process Automation and Instrumentation Market, By Region, 2018 - 2030 (USD Billion)
Figure 21 Europe Process Automation and Instrumentation Market Highlight
Figure 22 Europe Process Automation and Instrumentation Market, By Instrument, 2018 - 2030 (USD Billion)
Figure 23 Europe Process Automation and Instrumentation Market, By Solution, 2018 - 2030 (USD Billion)
Figure 24 Europe Process Automation and Instrumentation Market, By Industry Vertical, 2018 - 2030 (USD Billion)
Figure 25 Europe Process Automation and Instrumentation Market, By Region, 2018 - 2030 (USD Billion)
Figure 26 Asia-Pacific Process Automation and Instrumentation Market Highlight
Figure 27 Asia-Pacific Process Automation and Instrumentation Market, By Instrument, 2018 - 2030 (USD Billion)
Figure 28 Asia-Pacific Process Automation and Instrumentation Market, By Solution, 2018 - 2030 (USD Billion)
Figure 29 Asia-Pacific Process Automation and Instrumentation Market, By Industry Vertical, 2018 - 2030 (USD Billion)
Figure 30 Asia-Pacific Process Automation and Instrumentation Market, By Region, 2018 - 2030 (USD Billion)
Figure 31 RoW Process Automation and Instrumentation Market Highlight
Figure 32 RoW Process Automation and Instrumentation Market, By Instrument, 2018 - 2030 (USD Billion)
Figure 33 RoW Process Automation and Instrumentation Market, By Solution, 2018 - 2030 (USD Billion)
Figure 34 RoW Process Automation and Instrumentation Market, By Industry Vertical, 2018 - 2030 (USD Billion)
Figure 35 RoW Process Automation and Instrumentation Market, By Region, 2018 - 2030 (USD Billion)
Global Process Automation and Instrumentation Market Coverage
Instrument Insight and Forecast 2025-2030
- Field Instrument
- Control Valve
- Analytical Instrument
Solution Insight and Forecast 2025-2030
- PLC
- DCS
- SCADA
- HMI
- Safety Automation
- APC
- MES
Industry Vertical Insight and Forecast 2025-2030
- Food & Beverages
- Pharmaceuticals
- Chemicals
- Energy & Power
- Oil & Gas
- Metals & Mining
- Water & Wastewater
- Pulp & Paper
- Others
Geographical Segmentation
Process Automation and Instrumentation Market by Region
North America
- By Instrument
- By Solution
- By Industry Vertical
- By Country – U.S., Canada, and Mexico
Europe
- By Instrument
- By Solution
- By Industry Vertical
- By Country – Germany, U.K., France, Italy, Spain, Russia, and Rest of Europe
Asia-Pacific (APAC)
- By Instrument
- By Solution
- By Industry Vertical
- By Country – China, Japan, India, South Korea, and Rest of Asia-Pacific
Rest of the World (RoW)
- By Instrument
- By Solution
- By Industry Vertical
- By Country – Brazil, Saudi Arabia, South Africa, U.A.E., and Other Countries
Vynz Research know in your business needs, you required specific answers pertaining to the market, Hence, our experts and analyst can provide you the customized research support on your specific needs.
After the purchase of current report, you can claim certain degree of free customization within the scope of the research.
Please let us know, how we can serve you better with your specific requirements to your research needs. Vynz research promises for quick reversal for your current business requirements.
Purchase Options
Latest Report
Research Methodology
- Desk Research / Pilot Interviews
- Build Market Size Model
- Research and Analysis
- Final Deliverabvle
Connect With Our Sales Team
- Toll-Free: 1 888 253 3960
- Phone: +91 9960 288 381
- Email: enquiry@vynzresearch.com
Process Automation and Instrumentation Market
Global Process Automation and Instrumentation Market – Analysis and Forecast (2025-2030)
- The global process automation and instrumentation market will grow from USD 70 billion to USD 82.6 billion at a CAGR of 2.7%.
- The market is divided by instruments, solutions, and industry verticals, with each segment further divided into several subsections displaying significant growth potential during the forecast period.
- The growth drivers of the market include the rising focus on energy efficiency, cost reduction, digitalized platforms, industrial automation, stringent compliances, optimization of resources, investment in the automotive industry, and upgrades of manufacturing units.
- The hindrances to growth include high initial investments, high operational and maintenance costs, and lower penetration by SMEs. Growth opportunities lie in a rise in demand for safety automation systems, equipment malfunctioning, and the need to control emergency and complex procedures.
- The APAC market will grow due to an increase in infrastructural investments, demand for power reliability, and need for increased oil & gas and food & beverage production due to population growth, rapid industrialization, supportive government policies, and continual growth in industrial activities.
- The APAC market will grow due to an increase in infrastructural investments, demand for power reliability, and need for increased oil & gas and food & beverage production due to population growth, rapid industrialization, supportive government policies, and continual growth in industrial activities.